Paths
This document describes the use of path metrics and steps to create paths.
Path Metrics is an effective analytical tool from Lemnisk that allows you to know your campaign performance and its engagement level by knowing every action performed by users in between, before and after certain events. This supports knowing about the user actions across all data sources not limited to just App and Website and identifying the bottlenecks that deviate the users from achieving a certain event and drop off.
Path Metrics will also support the business to identify the flaws in the architecture of their Website/Application and campaign performance and optimize it with precise data analytics rather than making decisions by guesswork. With this feature, businesses can gain promising engagements with proven records from the history of user behaviour.
Use Case
Let's say,
As a marketer, you want to know the actions of the users and analyse where the major drop off and major conversion happens in your website/Application. Creating a perfect journey towards your end goal and analyzing the journey performance will help you to know your users better and support you in improving your campaign performance. This will also help to architect a better website or application that directs the users towards reaching the end goal without any deviations.
Let's assume you are a marketer of an e-commerce business and you want to know at which point the majority of users get dropped off. You can configure the journey with multiple events likeproductVisited,added to wishlist,Checkout etc. If there occurs a major dropoff after the event product visited or before Checkout, you can analyse the actions performed before after and between each event to get detailed insights into your user behaviour with the help of these path metrics and optimize your platform or marketing campaign for better traction.
It also supports you to gain answers to critical business questions like,
What are the activities performed by the user before attaining a certain event?
When do users exit the Website/Application?
How do users move from one step to another?
When do users drop off before purchasing a product?
What makes a user uninstall the application?
Before diving deep into the path let's know how to read the path by knowing its indicators.
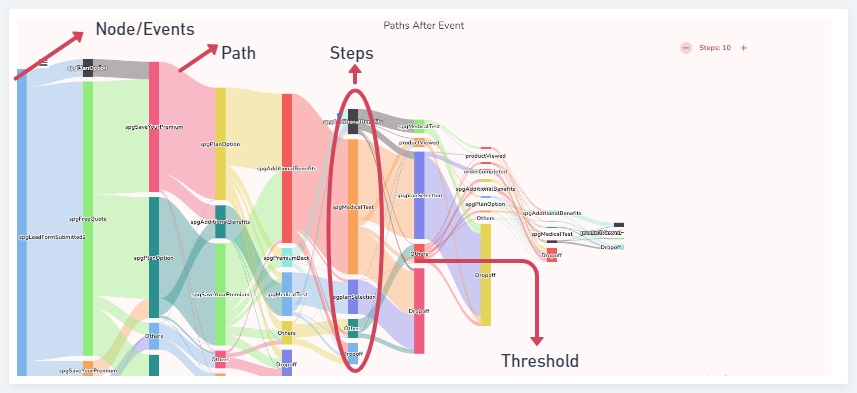
Analyzing the Path Diagram
Event: Each action configured in the path like, product visited, check out, drop off, etc.
Steps: Number of actions performed by the user before, after or in between certain events, which is also a collection of events.
Node: Each event is a node, hovering over each node will show the number of drop-offs and the next steps with its counts and percentage.
Path: Path is the direction the user took from one event to another event in another set of steps. hovering over the path will show the direction of each path from one step to another.
Steps to plot the path
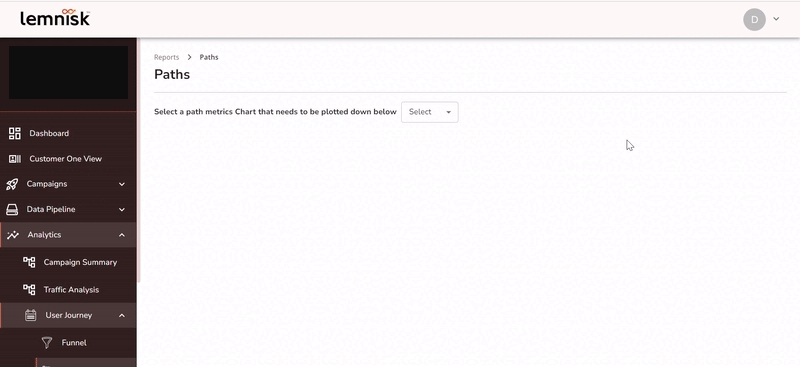
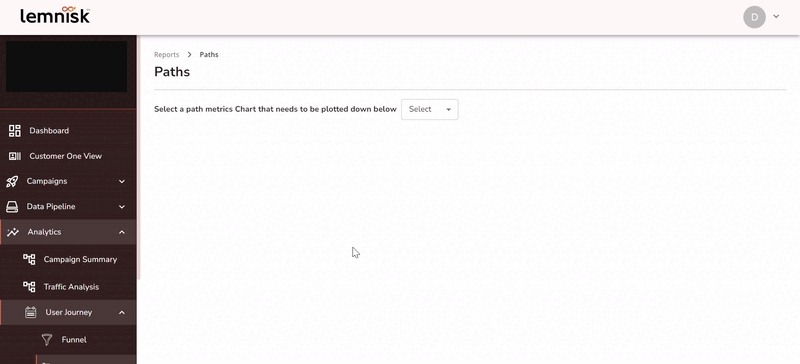
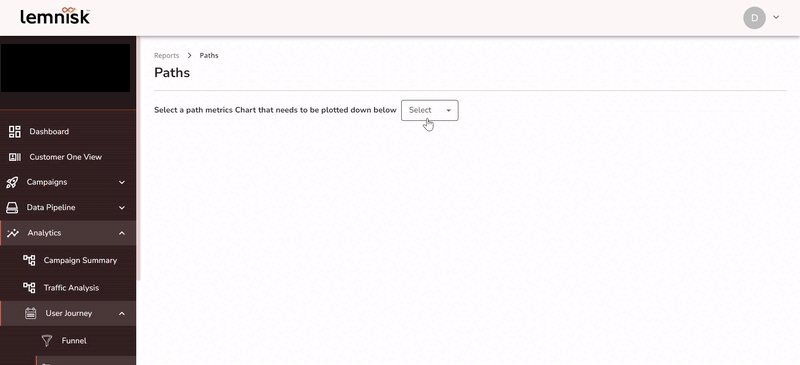
Go to > Analytics > User Journey > Path
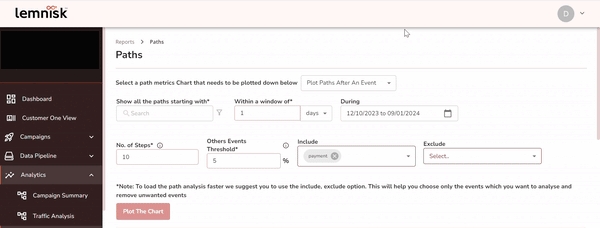
Step 1: Select a path metrics chart that needs to be plotted down. You can Plot the paths Before an Event, After an Event or Between the Events.
Before an Event: The plot will be shown before a certain event. The steps will be calculated from the point before the particular event.
Between Events: The plot will be shown from one event to another. The steps will be calculated between those events.
After an Event: The plot will be shown after triggering a certain event. The steps will be calculated from the point the event is triggered
Step 2: While choosing path metrics as After an Event in Step 1, Select the path you want to plot from Show all paths starting with. These paths can be configured by the marketer based on the website/Application.
If you choose Between Events in Step 1, Then you must select Events from Show All Paths starting with and the Events from Show All Paths ending with.
If you choose Before an Event in Step 1, Then you must select Events From Show all paths ending with to plot the charts.
Filters
You can plot the Paths by filtering the data based on URL to segregate precise data as required
Case 1: Filter event based on URL
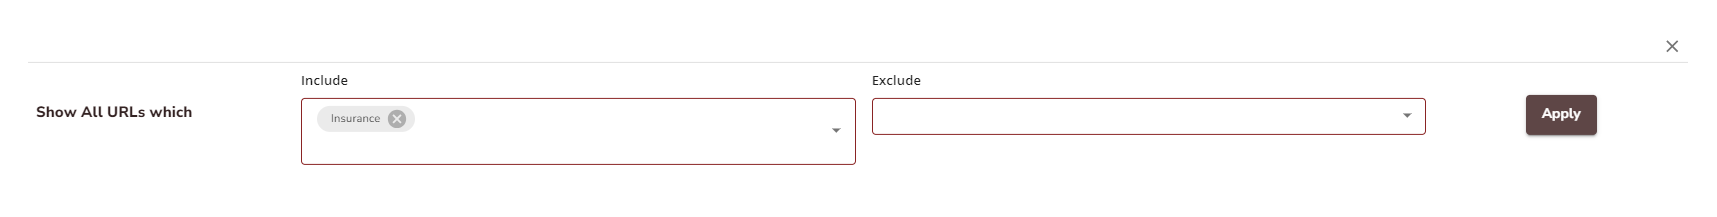
In this use case, we plot the path After an event Productviewed and filter it with the URL that includes Insurance.
Clicking on the filter icon beside the event will pop up the following Input window where you can filter the the path based on URLs
The path will be plotted for the applied filters as shown below.
For events Open, Click and Impressions you can filter the paths based on Browser, Segment and engagement as follows. These events were tracked from Lemnisk's Engagement.
Case 2: Event Engagement_Open
Engagement_OpenIn this use case, we select the following event combination to plot the path based on engagement level na d filter it in browser level.
1) Engagement_Open from the drop-down in Event 1.
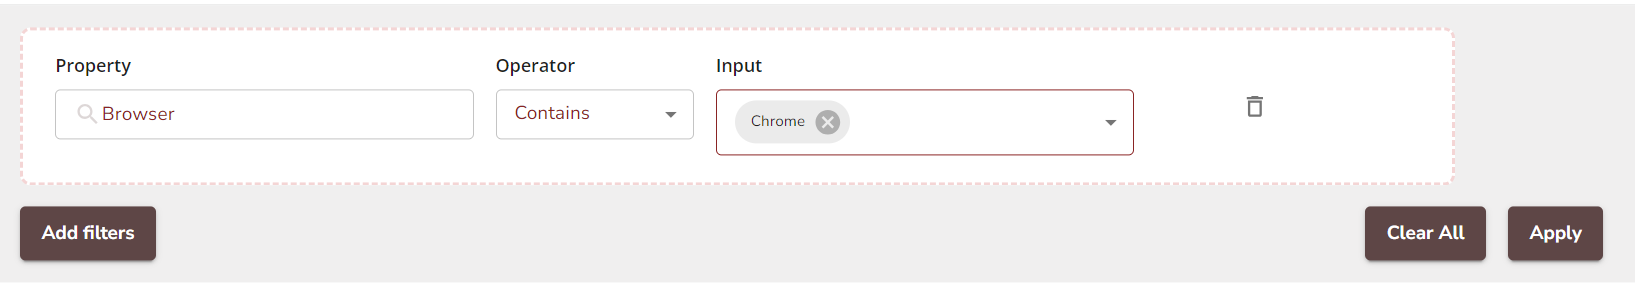
Click on the Filter Icon, select Add filter and apply the filters as follows
Property: Browser
Operator: Contains
Input: Chrome
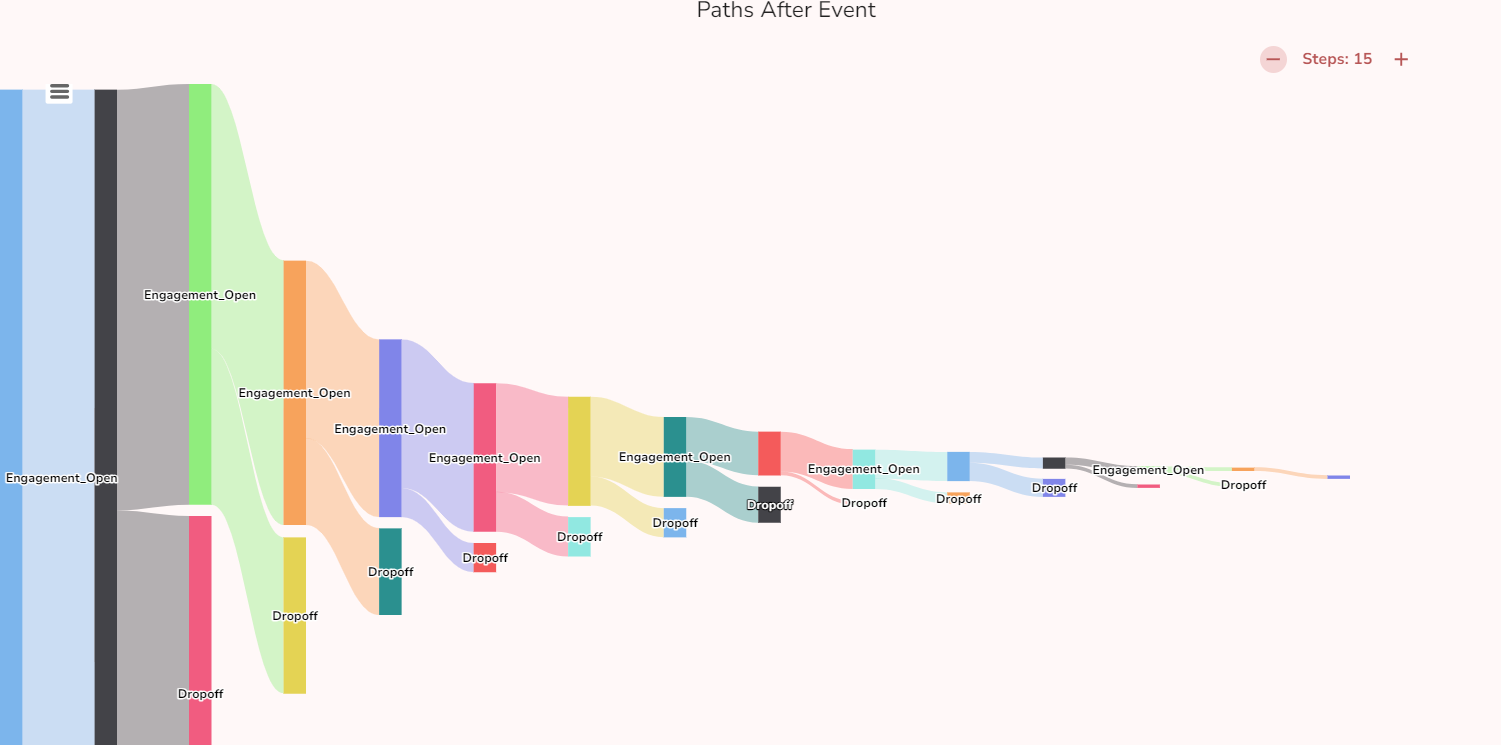
The Paths will be plotted as shown below,
Step 3: Select the window period from Within the window of. In this demo, we selected "one day".
For example, if you choose within starting event as ProductVisitedand within the window of "1 day " and the time frame as "Last 90 days" " it will show the actions performed by the user within a day from the selected event in the "Last 90 days".
Step 4: Select the time frame in the field During. Here we have selected the time frame for the "Last 90 days".
Step 5: Select the number of steps that you want to know before any certain event. Here we selected "10 steps". you can choose up to 15 steps.
Step 6: Select the Other Events threshold. Here we selected "5%" as the threshold limit. Event threshold helps you to group multiple events with the least traction together that eventually fall under others. This grouping supports concentrating on signals rather than noise. you can set the threshold limit which should be at least 5 percent and maximum up to 20 per cent.
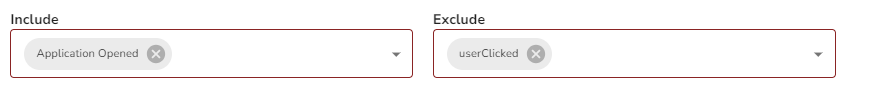
Step 7: Include and exclude events as per your data requirement.
Include Events: This allows you to add events to the path.
Exclude Events: Allows you to remove events that are not necessary for your data segregation
Step 8: Now click Plot the chart.
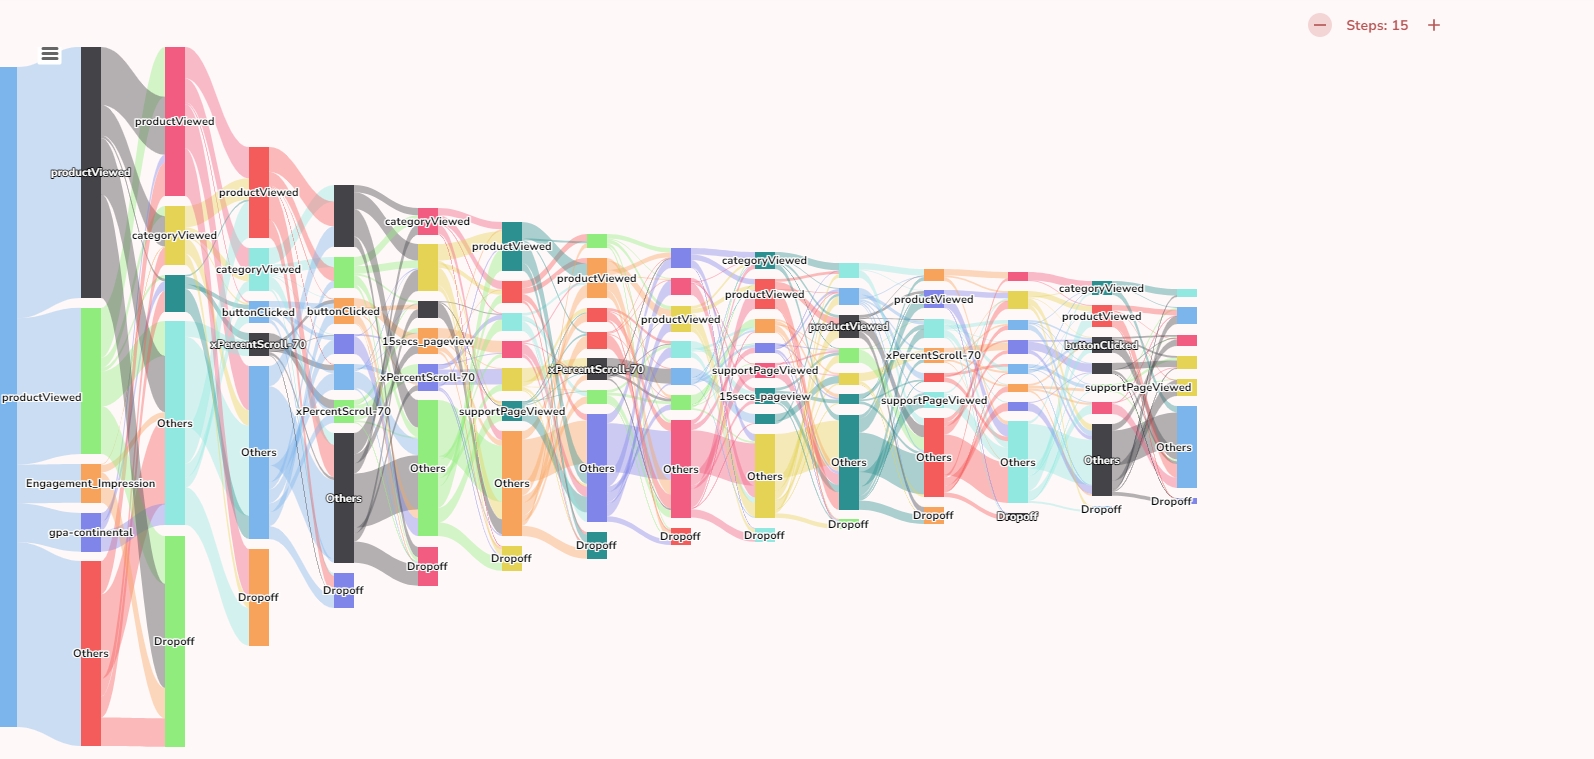
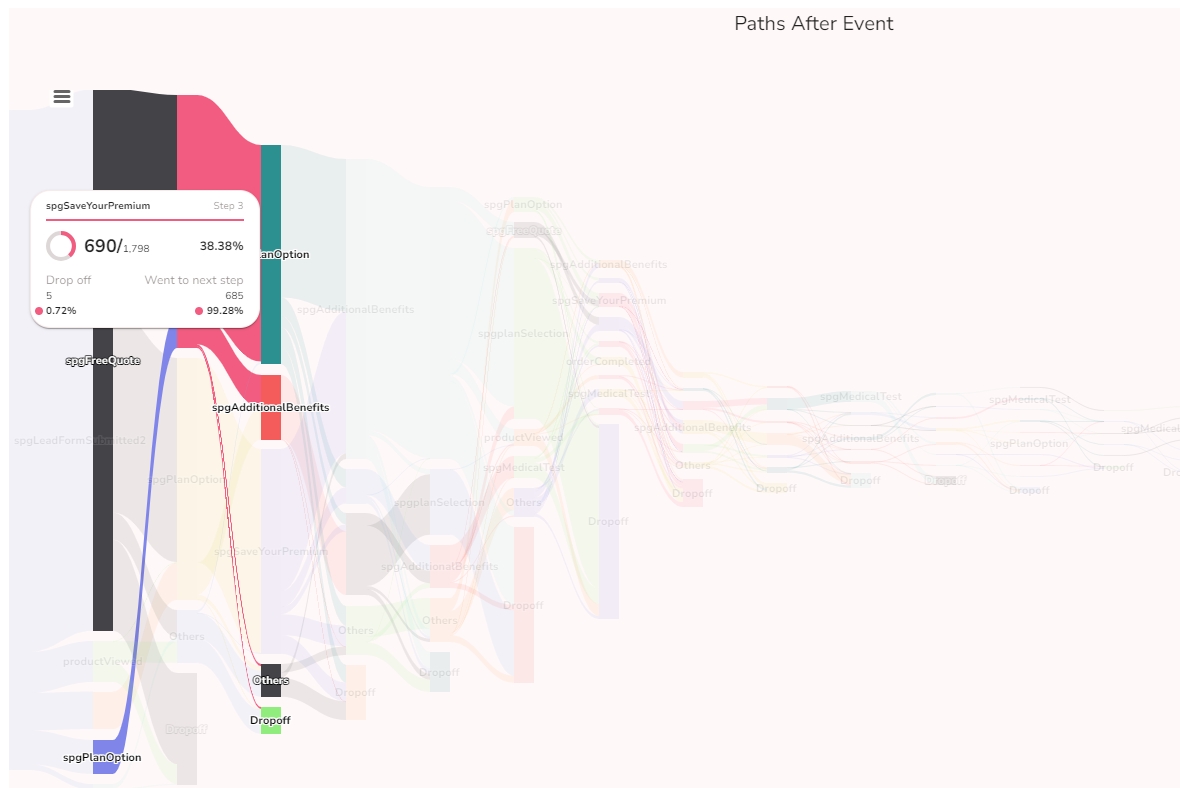
Plotting Paths After an Event
In the After Event, we show Drop off node at each step. This represents users who dropped off after performing the particular event(s) at that step. This gives you a clear understanding of where most of your users are dropping off and you can target them accordingly.
Hovering over Nodes and Paths
Nodes:
Hovering over each node in After events will show the number of dropoffs and the next paths with their counts and percentages.
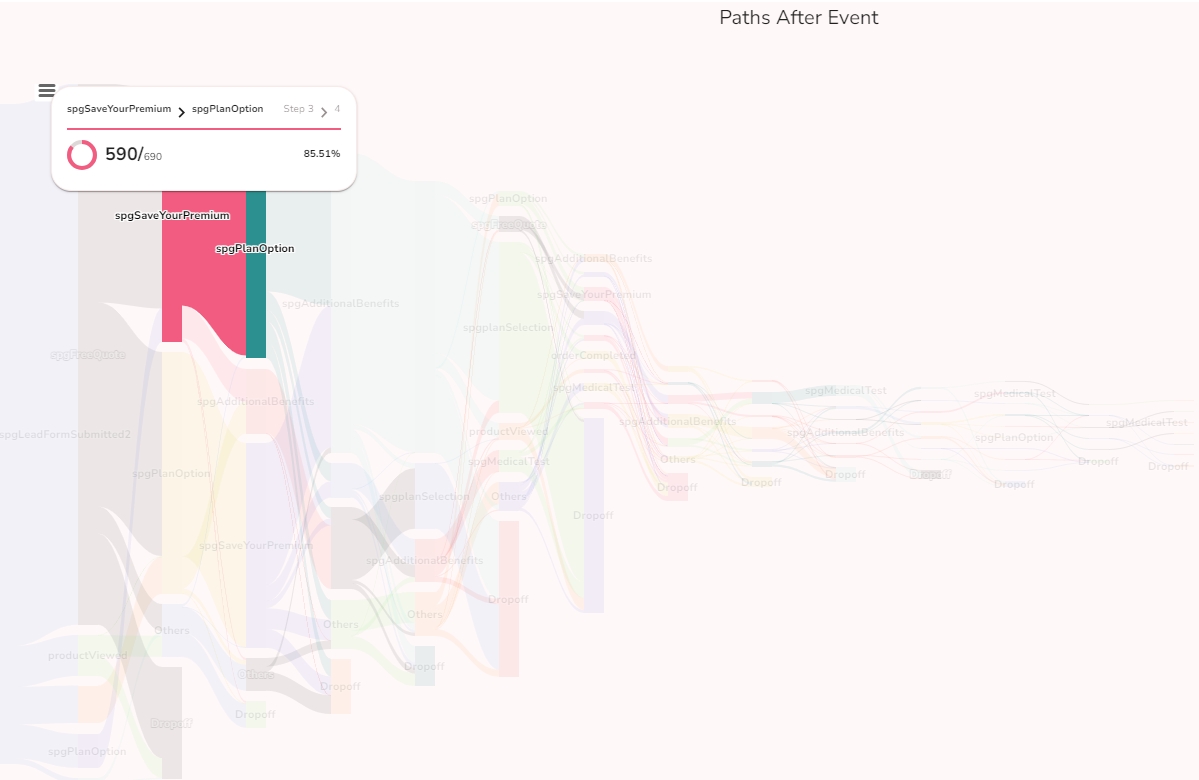
Paths:
Hovering over each path in After an Event shows the next steps the user made from one node to another along with dropoffs.
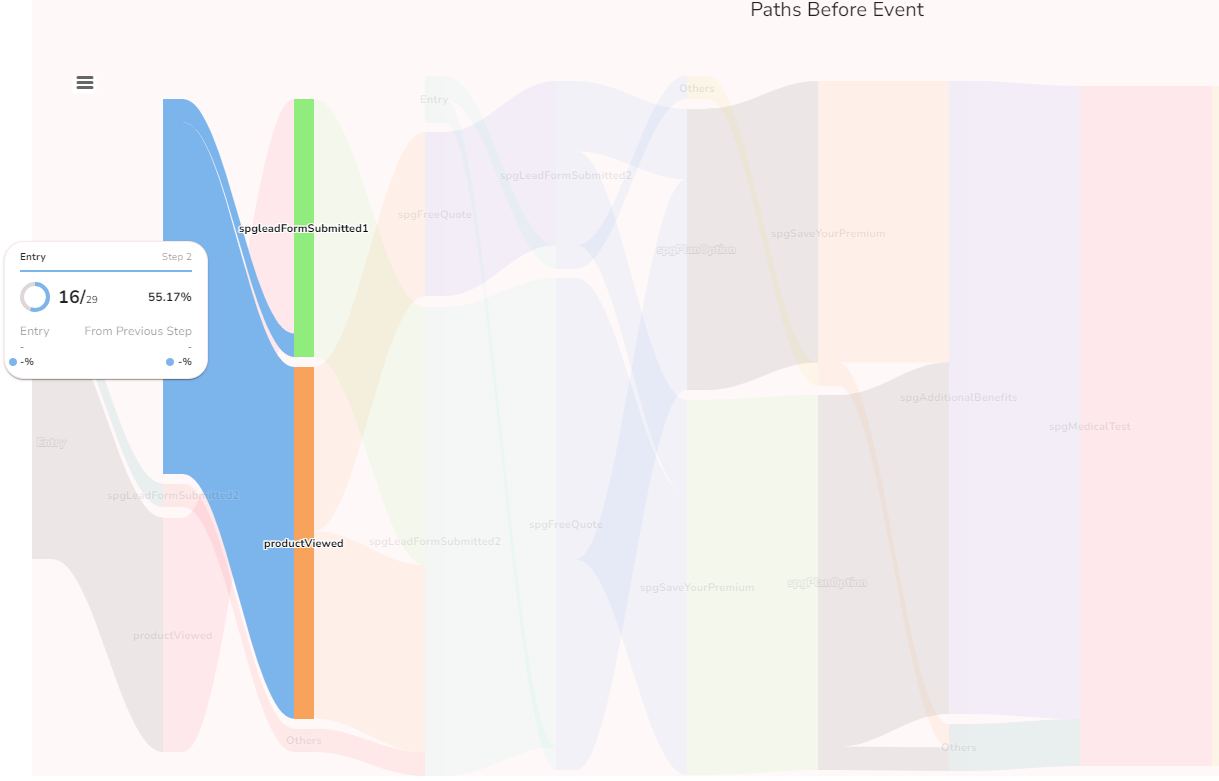
Plotting Paths Before an Event
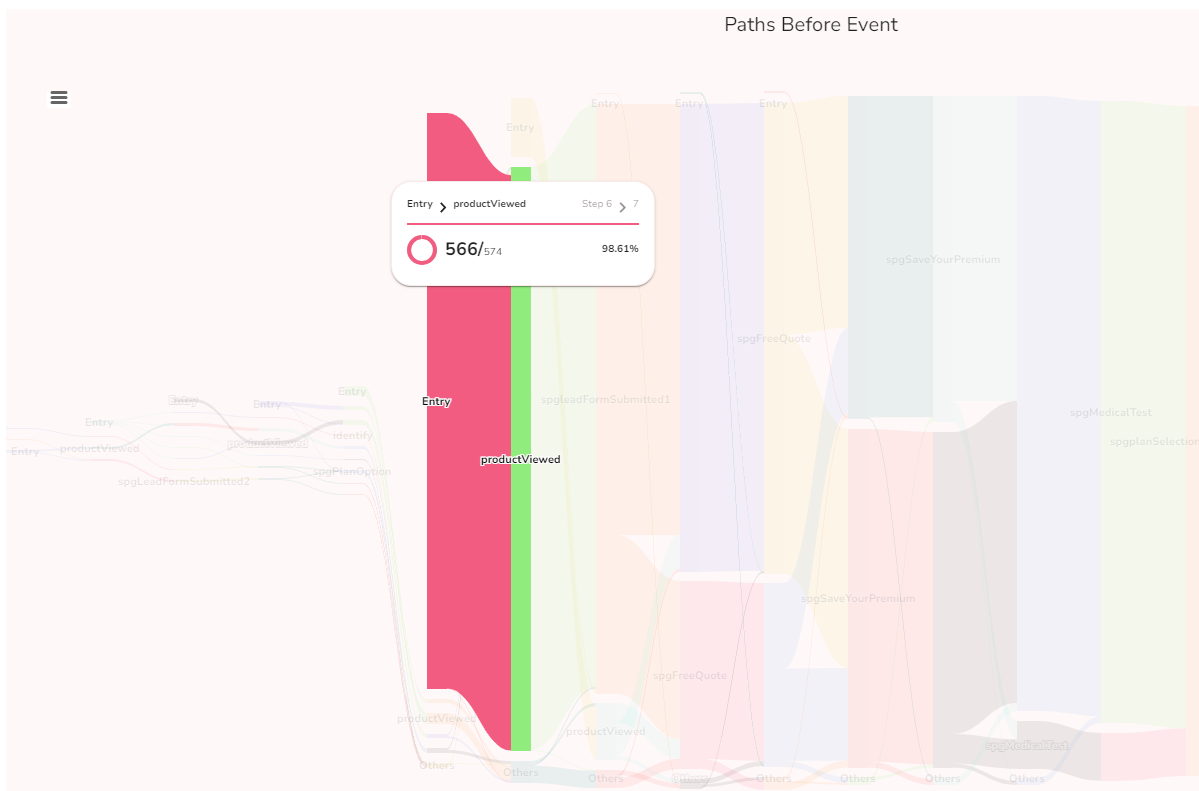
In the Before Event, we show the Entry node at each step. This represents users who directly entered the step instead of traversing from the previous step or path. This helps you understand the different touchpoints from where the users are coming directly instead of the intended path.
Hovering over Nodes and Paths
Node:
Hovering over each node in Before an Event shows the number of entries and the path from the previous steps with its count and percentage.
Paths:
Hovering over each path in Before an Event shows steps the user made from one node to another from their entry points along with its count and percentage.
Plotting Paths Between The Events
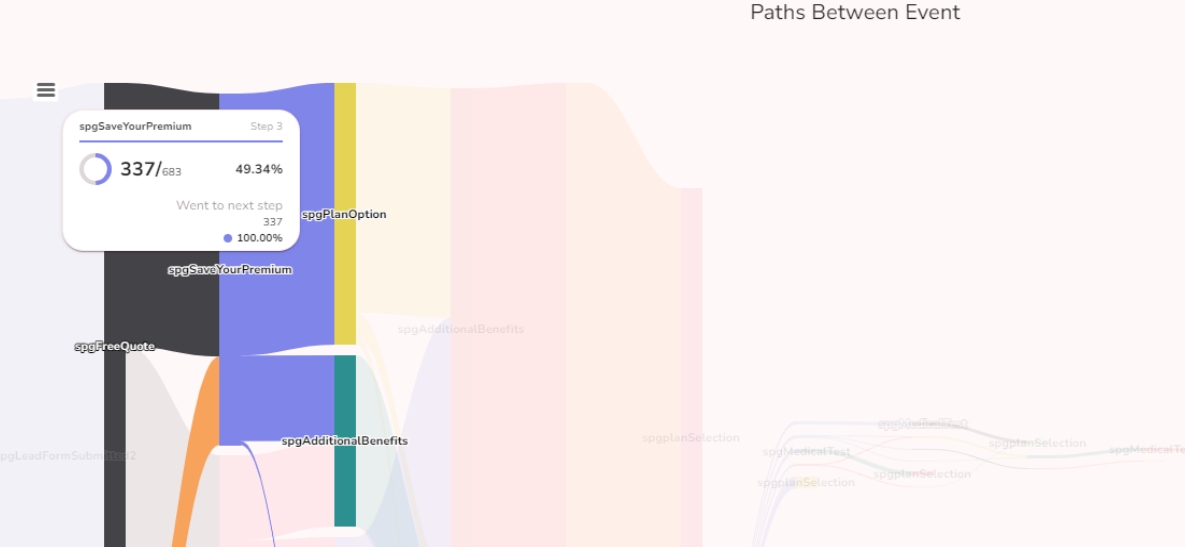
In the Between Event, we show the exact path(s) that the user took between the two events, hence there will be no dropoff or entry node present.
Hovering over Nodes and Paths
Nodes:
Hovering over each node in Between Events will show the number of users moved to the next step from any node with its counts and percentage.
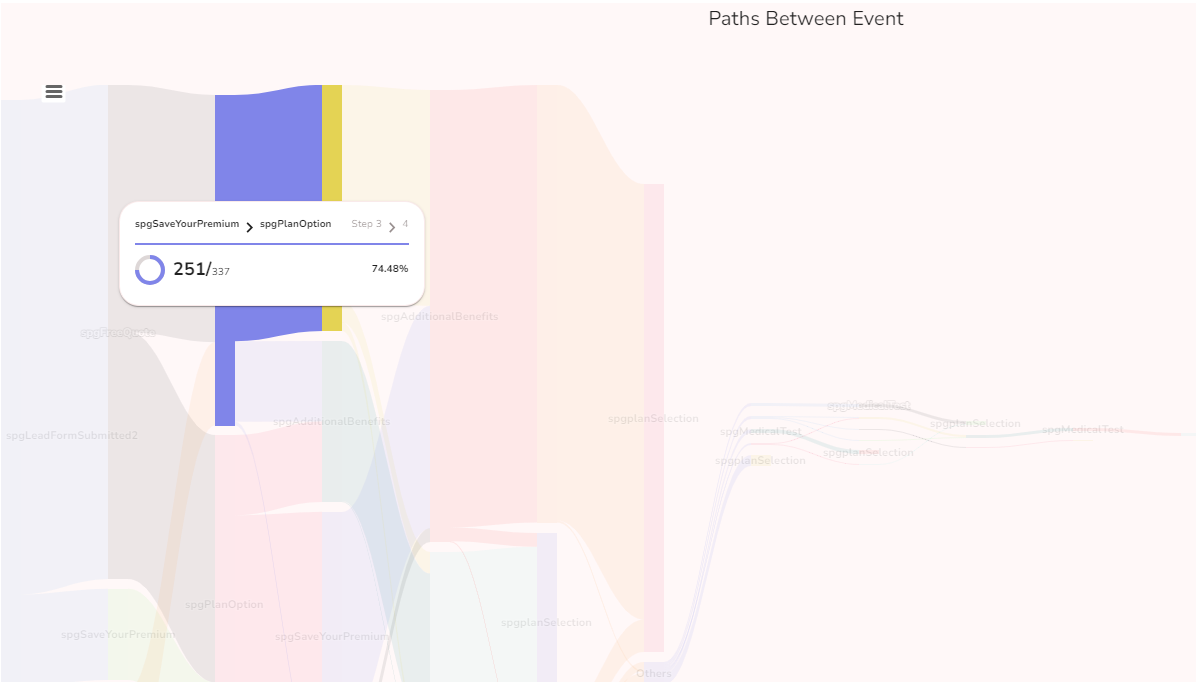
Paths:
Hovering over each path in Between Events shows the steps users made from one node to another except the dropoffs, with their counts and percentages.
You can add and remove the steps directly from the chart with the + and - icons at the top right corner of the window to get a clear view of each step and configure the plot as per your requirements. You cannot add or remove steps from the chart while plotting between the events.
Last updated