Events Occurrence
An overview of event occurrence, its types, and steps to plot a chart.
Interaction events- Interaction events are all interactive track events such as page, identity, and screen.
Event Occurrence in reporting provides you with a way to analyze the occurrence of events in relation to their number and users in accordance with the number of events taken place.
Let's assume, a marketer wants to track that how many times a particular event has occurred in a given time frame. S/he can keep track of the events performed by the user.
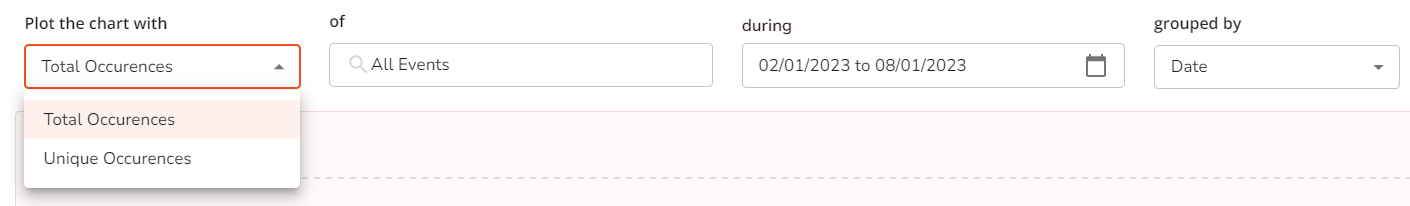
There are two types of Occurrences:
Total occurrences
Unique Occurrences
Hence, the total occurrence will always be greater than the unique occurrence, as the total occurrence depends on the activities performed by the user, while the unique occurrence depends on the user.
Total Occurrences: Total number of event(s) that occurred within the defined time range For instance, let's say you want to know how many events occurred regardless of the user accounts. The total occurrence will help you know the same.
Unique Occurrences: Total number of users who performed the event(s) within the defined time range Let's say you want to view how many users have performed a particular event regardless of the frequency of those events. The unique occurrence will show counts of the user who have performed the events.
Steps to Plot a Chart
Step 1: Locate event occurrence in the CDP Go to Reports > Events > Occurrence
Step 2: Choose any occurrence to plot the chart Choose whether you want to view the total or unique occurrence of the event list.
Step 3: Choose the event Choose all events or a particular event from the event list.
Step 4: Select the date Select the starting date and drag it to the end date of the occurrence.
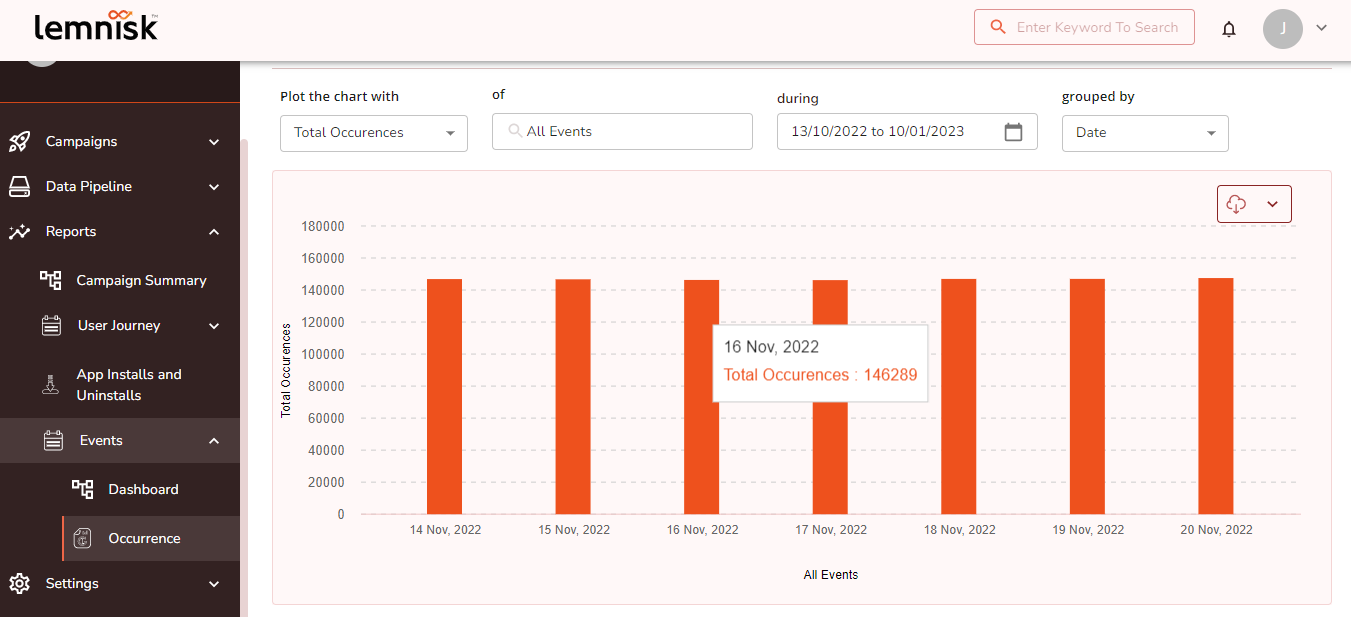
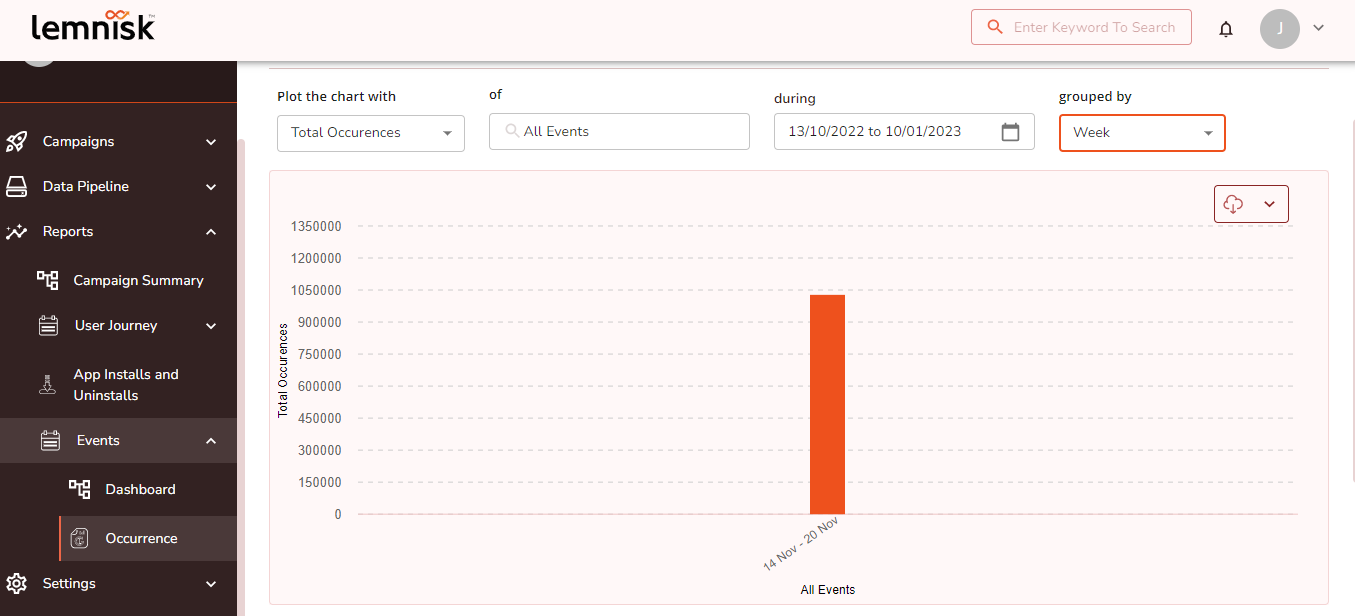
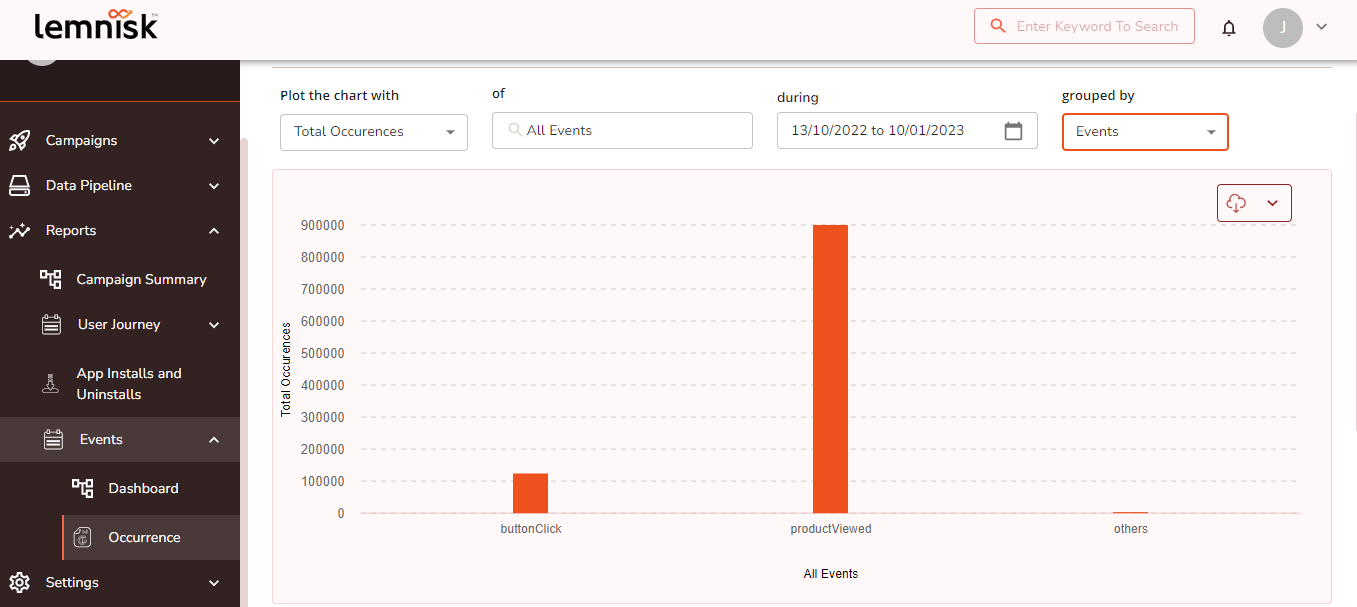
Step 5: Group the stats on the basis of date, week, month, and events
Date shows the occurrences on the basis of dates selected. This will group the selected events in date order.
Here is a video that walks you through the steps discussed above:
You can view the chart as well as a tabular representation of the occurrence.
Last updated