Guiding through the Dashboard
This document explains the component and the features of the dashboard.
Step 1: Navigate to > Dashboard.
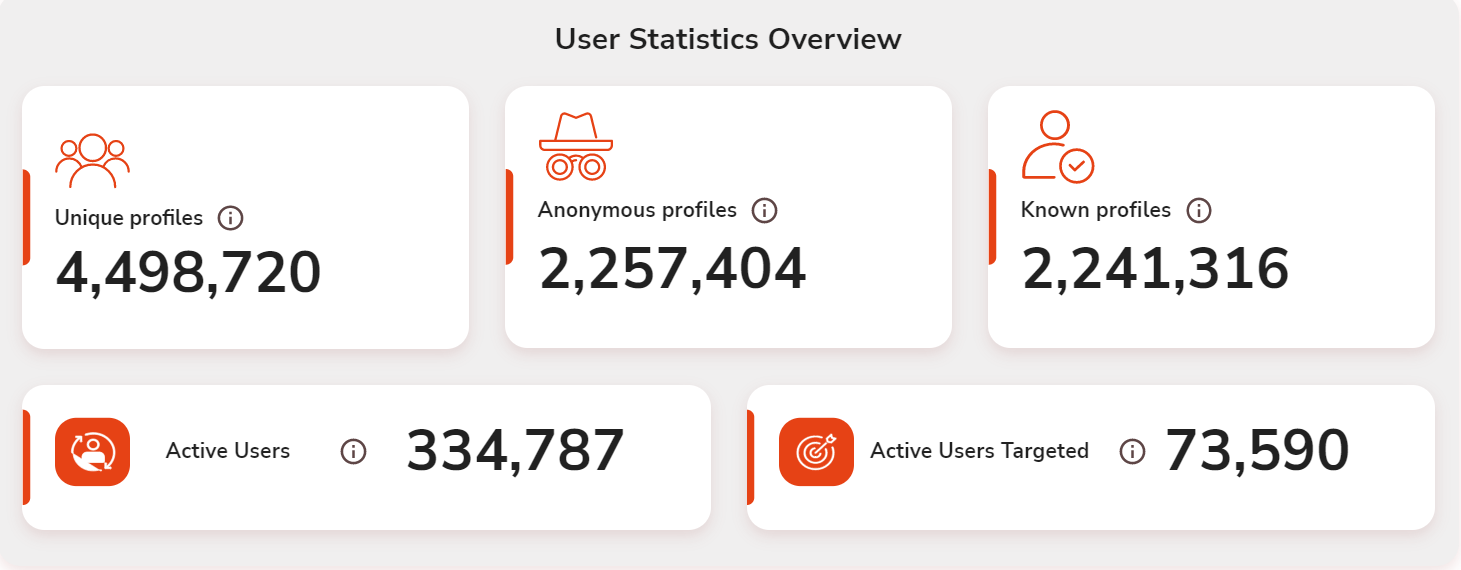
User Statistics Overview
This section displays the total number of users on your platform categorized into Unique Profiles, Anonymous Profiles, and Known Profiles from the date you started your journey on the platform.
| Data Points | Overview. |
|---|---|
Unique Profiles | Unique profiles are the summation of anonymous and known profiles in which at least one identifier will be used to identify the users' Eg: CRMID, Email, Mobile number, etc. You can target users through various channels using these identifiers depending on the identifier available for the user |
Anonymous Profile | Any profile in the database which is identified only with cookie Id and Device Id will be displayed under Anonymous profiles. You can target these users through channels like banner personalization, on-site notification, and web push notification. |
Known Profiles | Known profiles will be identified with the profiles which have personal identification Information (PII) and other defined user identifiers but not just cookie ID or Device ID. The number of profiles that carry personal information will be displayed under this category. You can target these users through any channel depending on the identifier available for the user. |
Active Users | Users who have performed any event or action through any of these sources within the given time frame. This data shows the active users for the last 30 days. |
Active Users Targeted | Users among the active users who have been targeted via one or more channels. This is the subset of active users. This data shows the active users for the last 30 days. |
The data of Active users and Active users targeted will be displayed only from the past 30 days.
Step 2: Select the Date range in the field displayed on the right edge of the window to fetch the data as per your required time frame.
The data presented after this point will be based on the date range you selected in the required field.
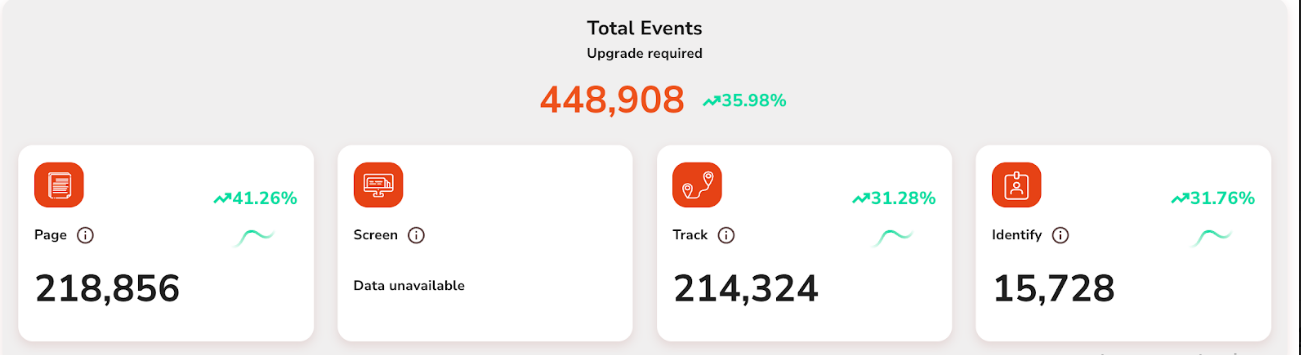
Total Events
Total Events shows the data of users who engaged with any specific events from your campaign. This is the sum of different events like Identify, Page, Screen, and Track events.
The data will be shown from the last 7 days by default. Your current data will be compared with the previous 7 days and the comparison will vary according to the data range you select. Eg: If you select the date range for 30 days, the current data will be displayed in comparison with the data of the previous 30 days.
| Events | Description |
|---|---|
Page Event | Page Event shows the number of users who visited the websites through the engagements triggered by your marketing campaigns. It helps you to create a customer funnel and identify on which page the user dropped. |
Screen Event | This event shows the number of users who visited the screens through the mobile devices in which your campaign engagement pops up to engage users. These event metrics support you in analyzing the performance and engagement level of your mobile application. It also helps you to create a customer funnel and identify on which screen the user dropped. The data is unavailable due to the lack of screen events that took place in our campaign. |
Track Event | Track event helps you to analyze the user behavior in your website or mobile application. Eg: Time spent on the app, the product added to the cart, a customer dropped from a video, etc. |
Identify Event | This event helps you to know about the users, their purchase history, subscriptions, memberships, etc. |
If the data for any metric doesn't flow through Lemnisk system, the Dashboard will display that metric with "Data Unavailable" prompt
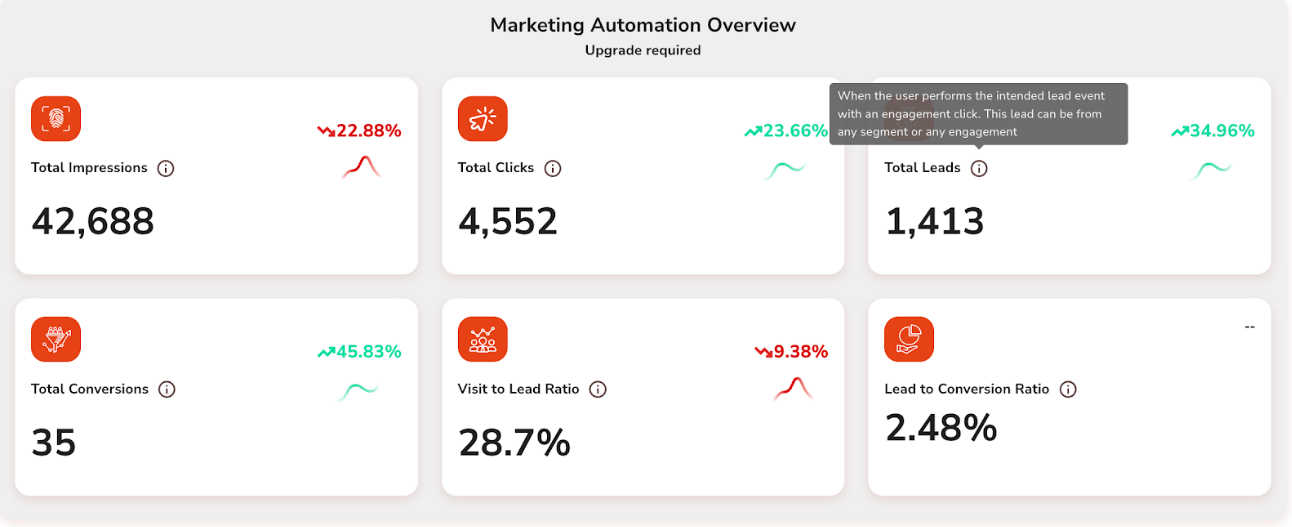
Marketing Automation Overview
This section shows an overview of your campaign performance as per each engagement proceedings from the marketing automation.
The metrics of each event will also be displayed in percentage; Green and Red indicators indicate the growth and decline in overall performance.
Total Impressions: Shows the total number of impressions served/clicks received for the selected time frame through the engagement triggered by your campaign.
Total Clicks: Shows the total number of clicks made in the engagement for the selected time frame
Total Conversions: Shows the occurrence of conversions that took place in the campaign with the engagement click for the defined time frame of 30 days. These conversions will be the subset of leads.
Total Leads: Shows the number of users who perform the intended lead event with an engagement click.
Visit to lead Ratio: Shows the total number of leads generated from the total number of unique visits in a selected time frame.
Lead to Conversion Ratio: Shows the percentage of lead conversations from the total number of leads generated from any engagement in a selected time frame. If the selected time frame is less than the average conversion period the ratio may not show any numbers for you.
Step 3: Now Click on Unique Profiles,
This window shows the data points that the platform has collected from the Unique profiles.
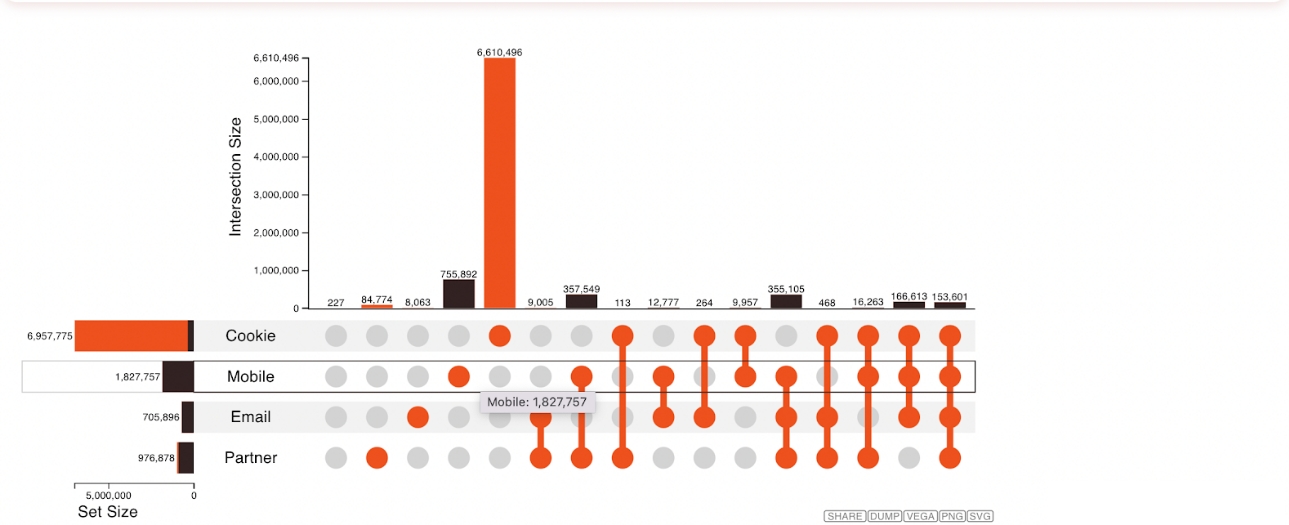
Unique Profiles
Interpretation of the above chart.
This graph interprets the stats from the data points of Unique profiles collected in the platform. The Orange dots in the graph represent the data points Partner, Email, Mobile, and Cookies. The orange line that connects the dots indicates the inclusion of two or more data points.
The pointer allows you to navigate and explore the data points by highlighting the presence of each data point's contribution to other data points in rows and column-wise. Eg: If you hover the pointer on Cookie in the row, it will highlight the number of cookie data present in other data points too.
The chart shows the platform has collected the following information about the users,
| Data points | Number of Users |
|---|---|
Partner | 976,878 |
705,896 | |
Mobile | 1,827,757 |
Cookie | 6,957,775 |
Partner & Email | 9,005 |
Partner & Mobile | 357,549 |
Partner & Cookie | 113 |
Email & Mobile | 12,777 |
Email & Cookie | 264 |
Mobile & Cookie | 9,957 |
Partner,Email & Mobile | 355,105 |
Partner,Email & Cookie | 468 |
Partner,Mobile & Cookie | 16,263 |
Email,Mobile & Cookie | 166,613 |
Partner,Email,Mobile & Cookie | 153,601 |
Other | 227 |
The platform also allows you to export the graph in multiple file formats such as SVG, and PNG which supports sending the data to other teams and stakeholders to make collaborative decisions.
Last updated