Data sanity between Funnels, Paths and Events
This document explains the differences in data between Funnels, paths, and events and the reasons behind them.
Funnels, Events, and Paths play a key role in evaluating your campaign's performance and making decisions for further improvement. Although these three components connect each other in decision-making based on the user journey, there can be a few mismatches in the data among the three in various cases, which are explained in detail with use cases and interpretations for a better understanding of the data and the causes of mismatches.
Before delving further into data sanity, let's take a quick look at these three key components that assist in understanding your campaign's performance.
Funnels
Funnels help you know the user drop-offs between one event and another, down to the final event, on a funnel basis. These funnels can be plotted based on the Unique Users and Total Occurrences to segregate the data accordingly.
Paths
Paths show the data of the user's journey between, before, and after certain events that took place in the user's journey. The path data can be segregated based on After events, Before events, and Between events to fetch the data accordingly.
Events
Events allow you to get the data of all the events or any particular events on a daily, monthly, and yearly basis. You can segregate the data based on Total Occurrences and Unique Occurrences.
Data Comparison Between Funnels, Events and Paths
In the upcoming demonstration, we compare the Funnel, Path, and Events simultaneously at the same time between July 1 and July 31 in order to interpret the differences in data in various cases.
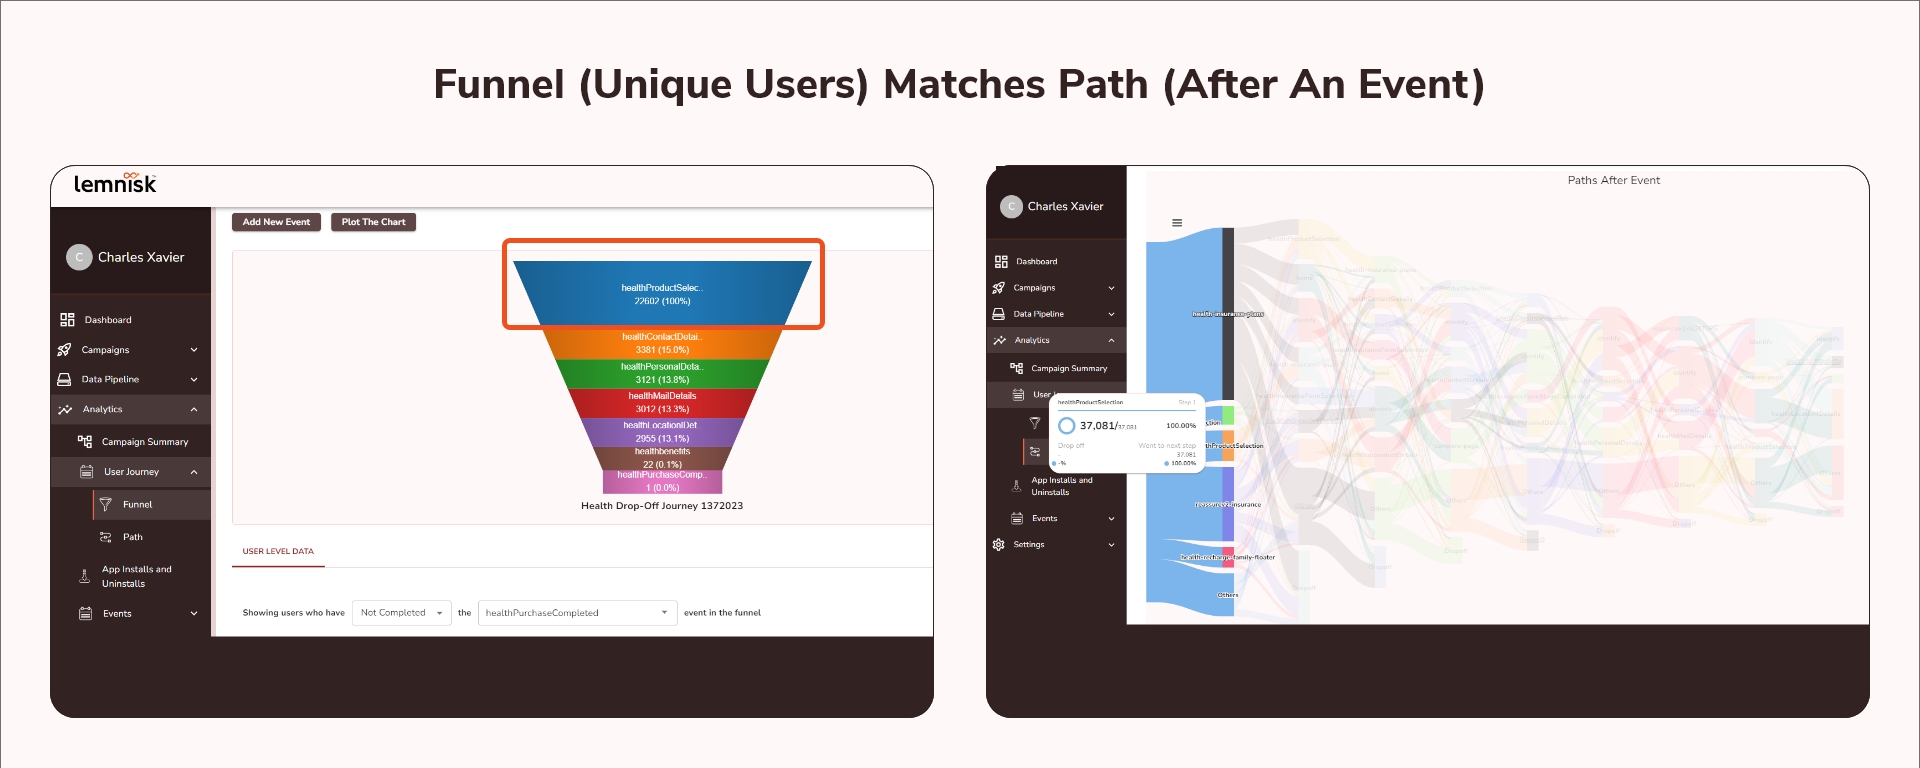
Case 1: The funnel data (Unique Users) may not match the data on Paths (After an event)
To compare the data between Funnels and Paths, let's take the funnel health drop-off Journey, plot the chart between the duration of July 1 and July 31, and plot the Path of healthProductSelection within the same time frame.
The data in the Path (After an Event), healthProductSelection, is 35,695, and the funnel data health drop-off Journey based on Unique Users, is 22,602.
The difference is because of two reasons:
The difference between the Funnel data and the Path data occurs because the data in the funnel is based on Unique users, and the data in the Path (After an Event) is based on the Total occurrence regardless of the unique user counts.
Paths are formed taking into account the lookahead window given by user (lookahead window refers to the maximum time difference between the first and last event), whereas Funnels considers consecutive events within 30 minutes while creating.
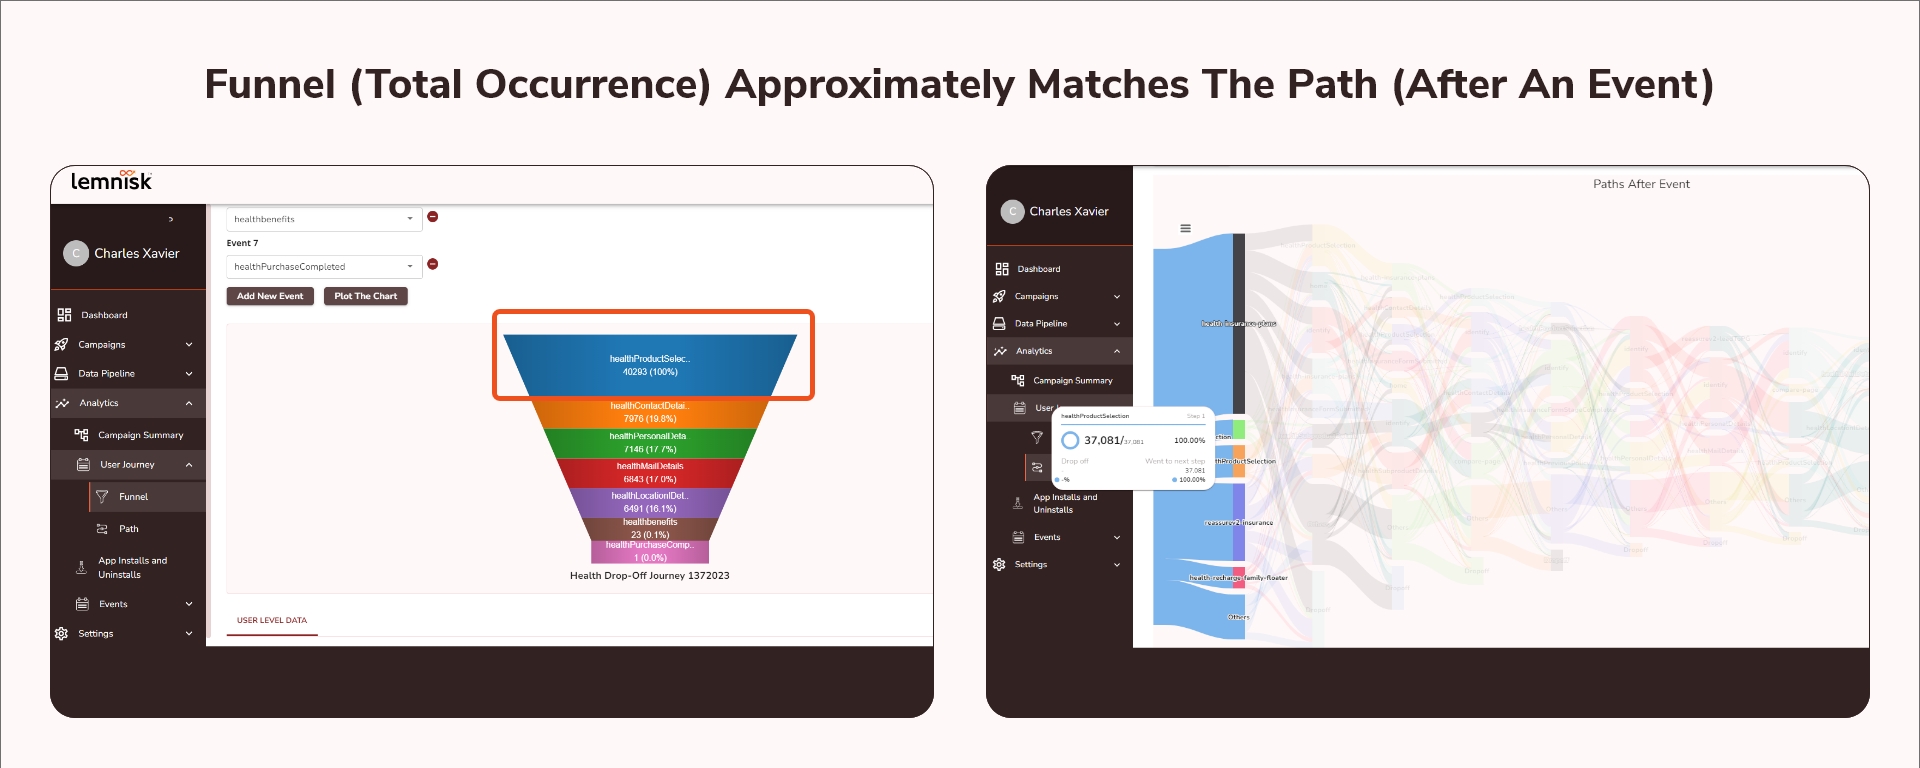
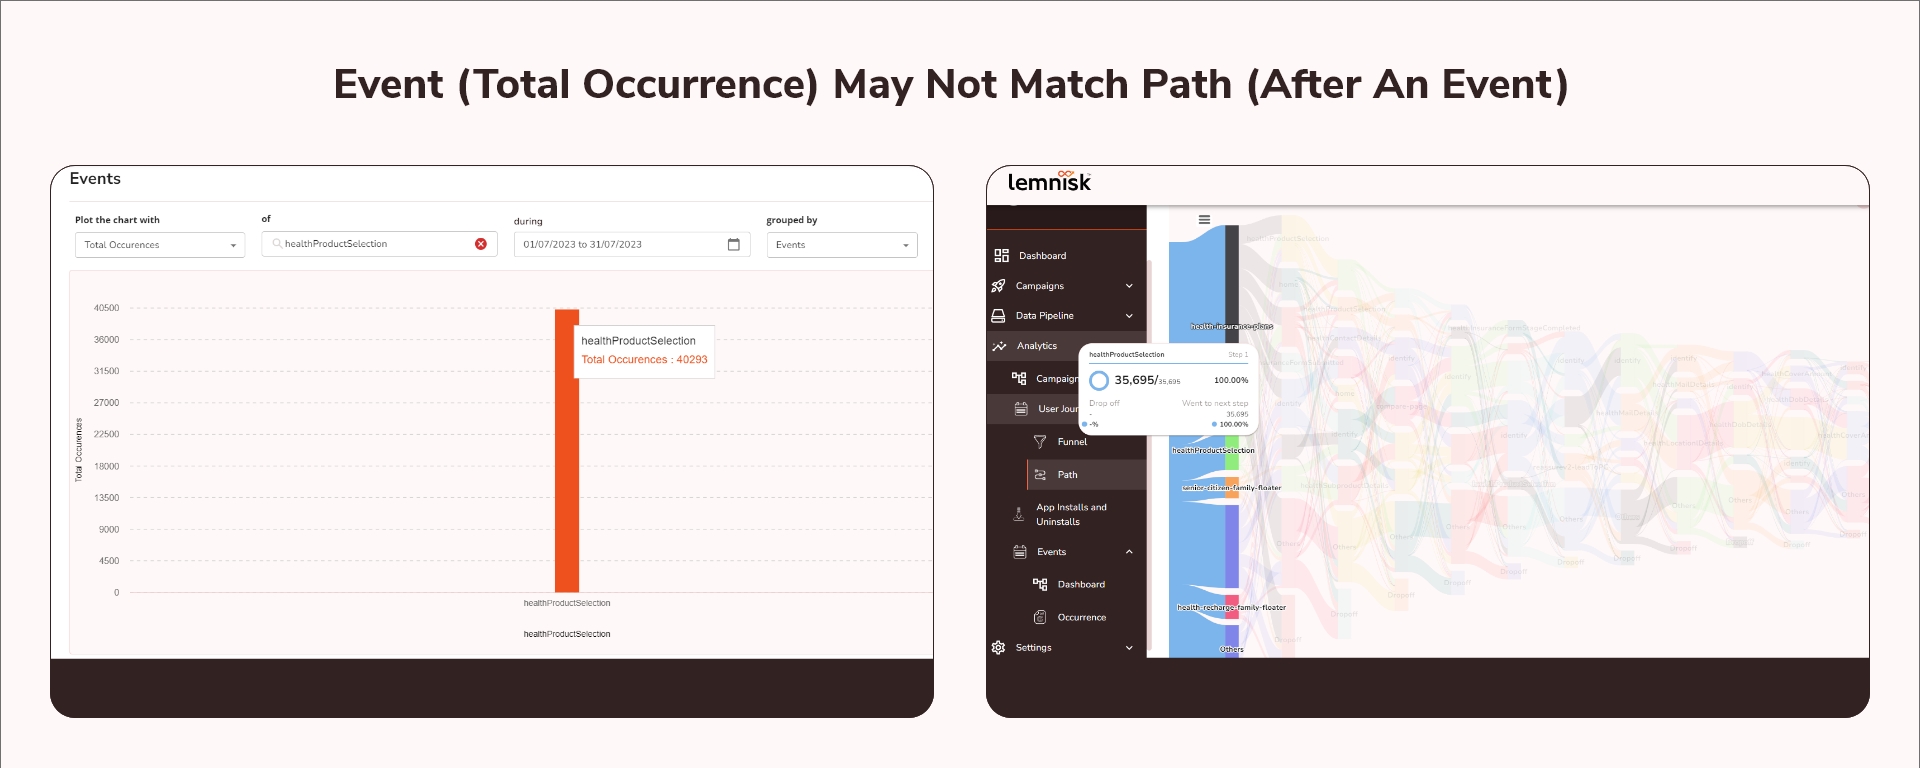
Case 2: The Funnel data (Total Occurrence) will not match with the data on Paths (After an Event)
From the below image comparison, the Funnel data based on Total Occurrence is 40,293, and the data in the Path (healthProductionSelection) is 35,695. The Funnel data based on Total Occurrence will not match the data on the Paths based on (After an event) even though both consider total occurrences. These differences occur between both data because Paths are formed taking into account the lookahead window given by user (lookahead window refers to the maximum time difference between the first and last event), whereas Funnels consider consecutive events within 30 minutes while creating.
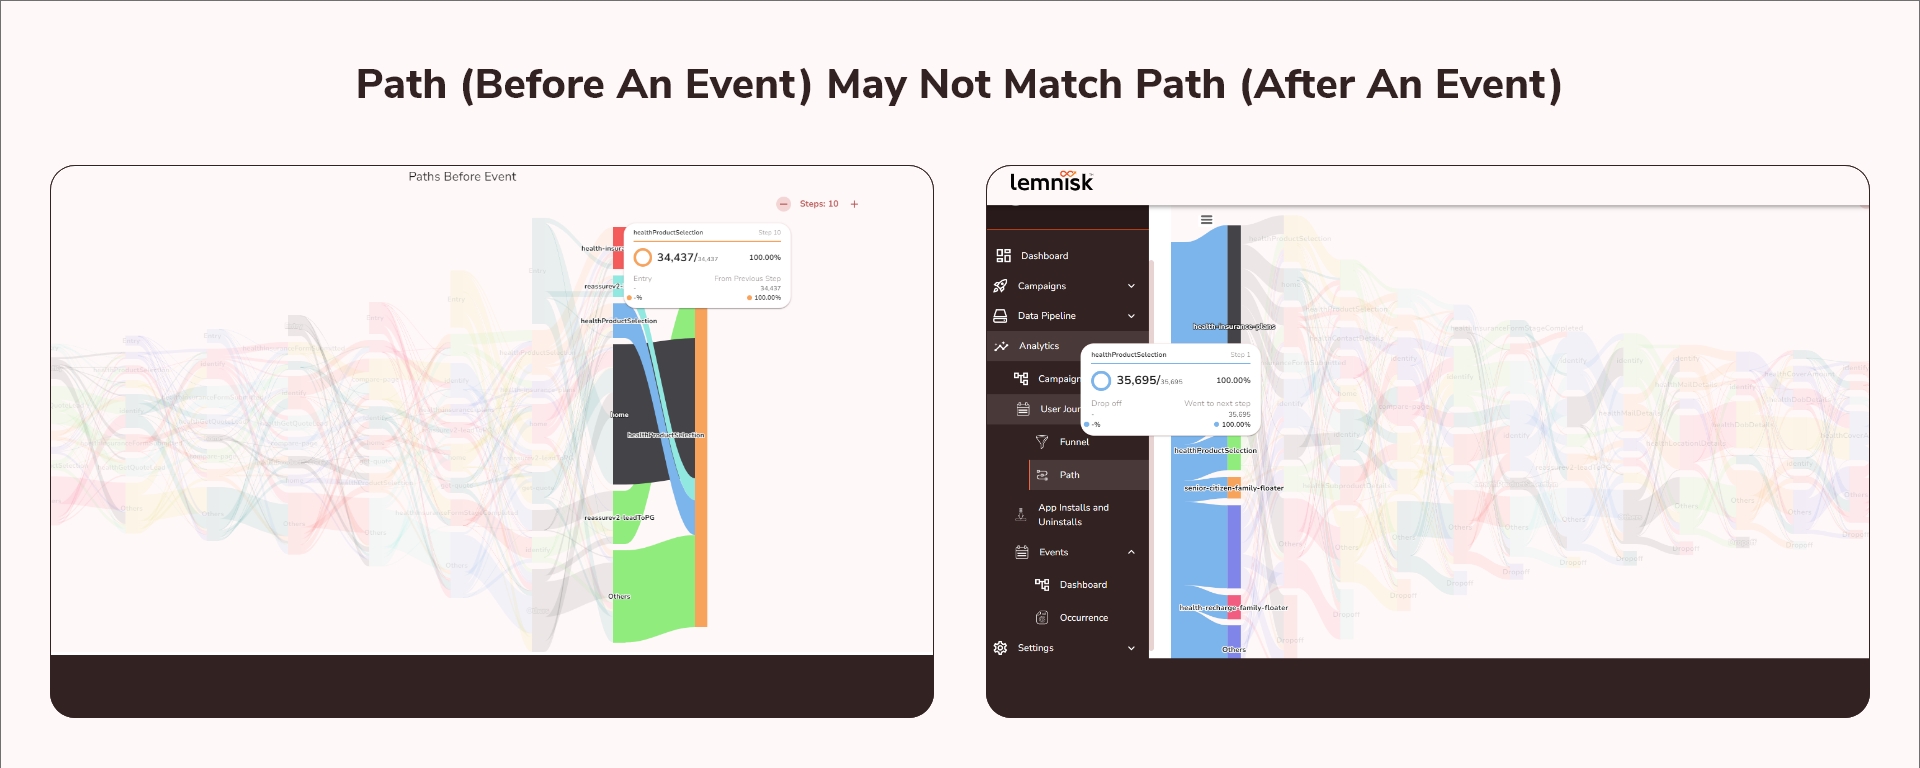
Case 3: The data in the paths (Before An Event) and (After An Event) may not match one another.
The data in the paths (Before An Event) and (After An Event) may not match because the user's entry to an event from other events and moving to another event is unpredictable and may occur randomly at any point in the path.
For a better understanding, let's plot the Path (Before An Event) healthProductSelection and (After An Event) healthProductSelection and fetch the data.
As the Path is based on events, it always shows the data based on Total Occurrence. The user counts (Before an Event) healthProductSelection is 34,437, and the user counts (After an Event) healthProductSelection is 37,081. This difference is because the users may enter the Event healthProductSelection from any different events in the path and the users from the Event healthProductSelection may move to any different events at any point in the path or even exit from the journey.
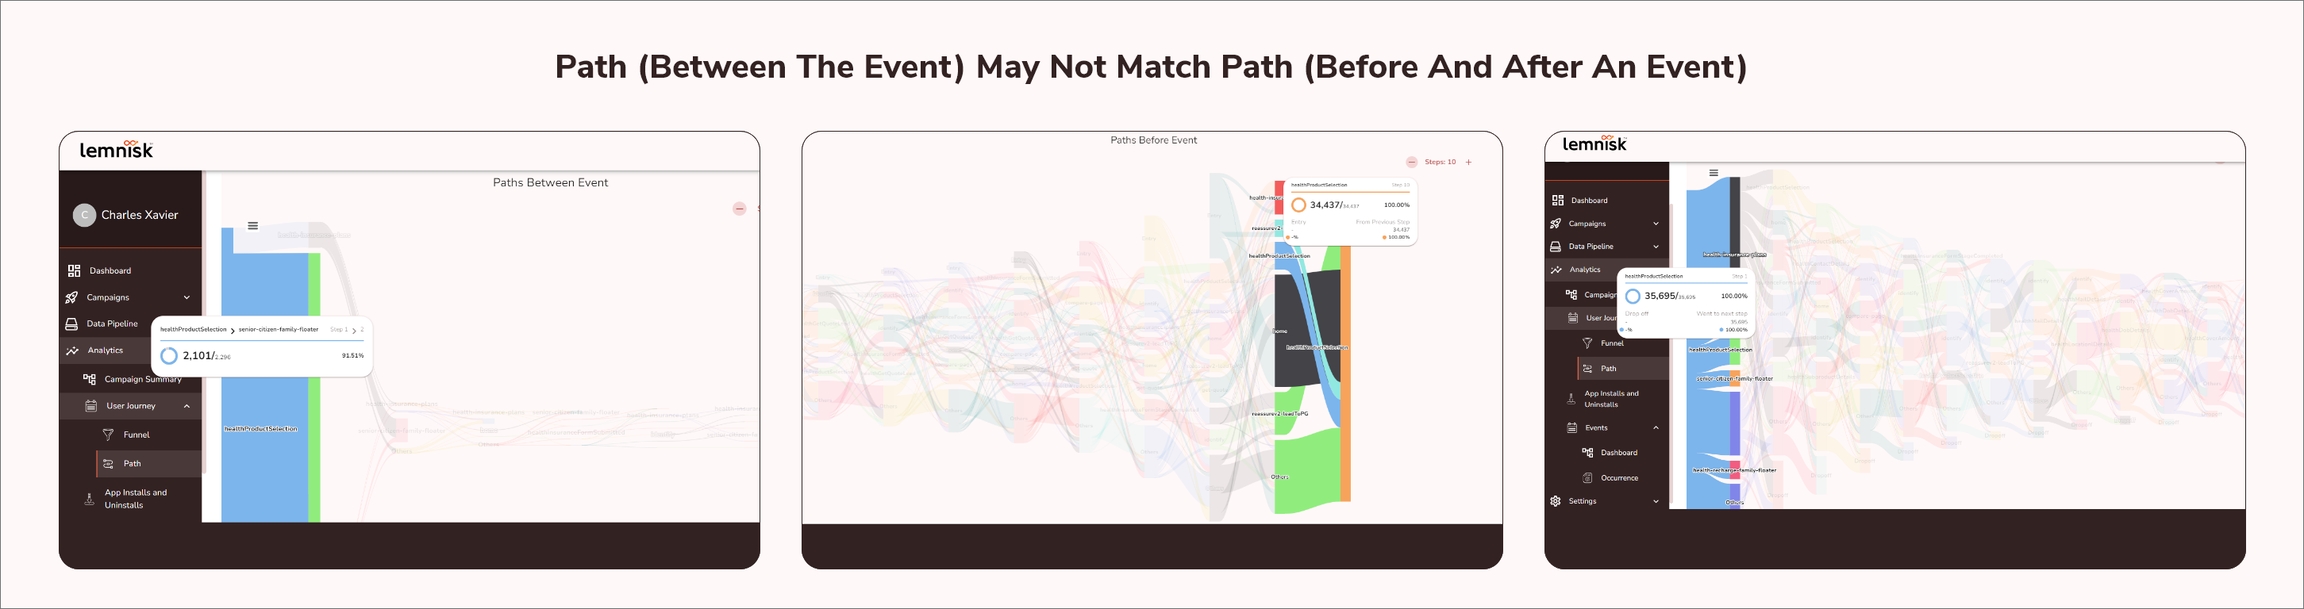
Case 4: The data in the path (Between events) may not match with the path (After An Event) and Path (Before An Event).
The data in Path (Between Events) may not match with Path (After An Event) and Path (Before An Event) because in Between events, the data will be shown from (Event A to Event B) whereas the paths (After and Before An Event) shows the data from any particular event to numerous different events and vice versa.
In the above image comparison, we plotted the Path (Between the event) healthProductSelection and senior-citizen-family-floater, in which the total user count is 2,101. The user count in the Path (Between Events) and the Path (Before and After An Event) is totally different because the data shown (Between Events) is only between the events healthProductSelection and senior-citizen-family-floater, whereas the Path Before and After an Event shows the data from the Event healthProductSelection to different other events and vice versa.
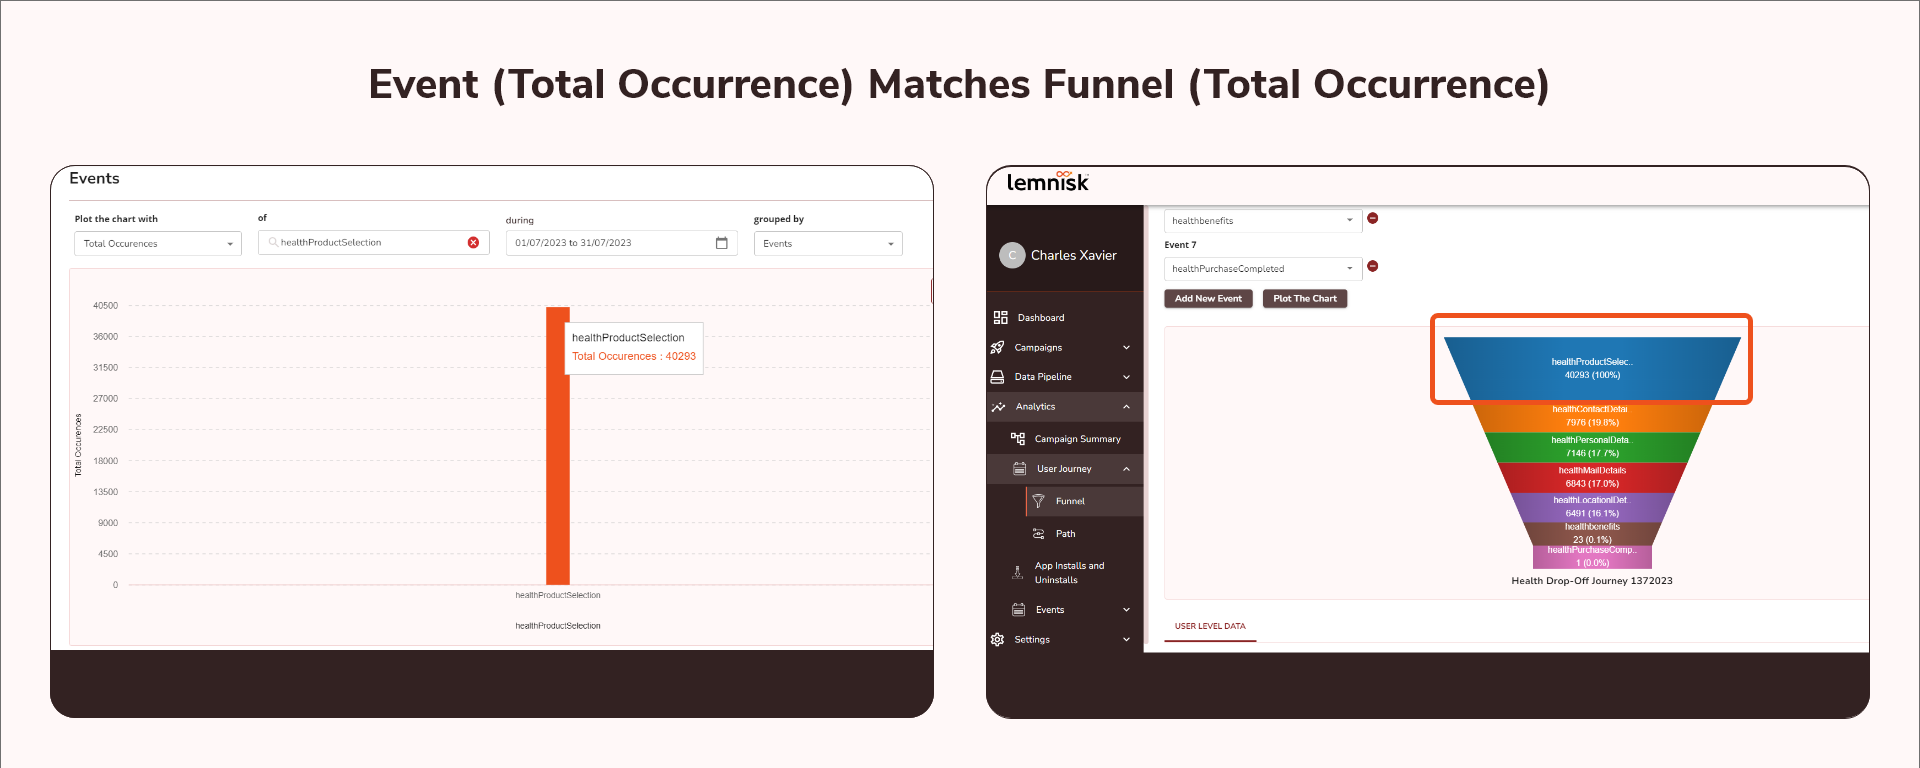
Case 5: The data between Events (Total Occurrences) and Funnels (Total Occurrences) will match one another.
The data in the Events (Total Occurrences) and Funnel (Total Occurrences) shows the data based on the events that occurred regardless of the unique users. As both the data in the Events and Funnels are based on Total Occurrences, the data between them will be the same.
In the above comparison, the data in the Event(healthProductSelection) based on total occurrences is 40,293 and the data in the Funnels based on Total Occurrences is also the same, as both data are based on events regardless of the Unique Users.
Note: If you have selected a time range before November 3rd,2023 then there will be a mismatch in the count. This is because we have changed how we are loading data into event occurrences which takes into account bot activity.
The count will match if you compare data created after November 3rd 2023.
Case 6: The data in the Event based on Total Occurrences may not match the data in Paths (After An Event).
The data in the Event based on Total Occurrences may not match the data in Paths (After An Event). The data in Path (After An Event) may vary due to events that may occur later at any point in the defined path.
The user count in the Event healthProductSelection, based on the Total occurrence, is 40,293 and the user count from the Path (After An event ) healthProductSelection is 37,081. This difference is due to the Event healthProductSelection, which may occur later at any point in the path of the user's journey.
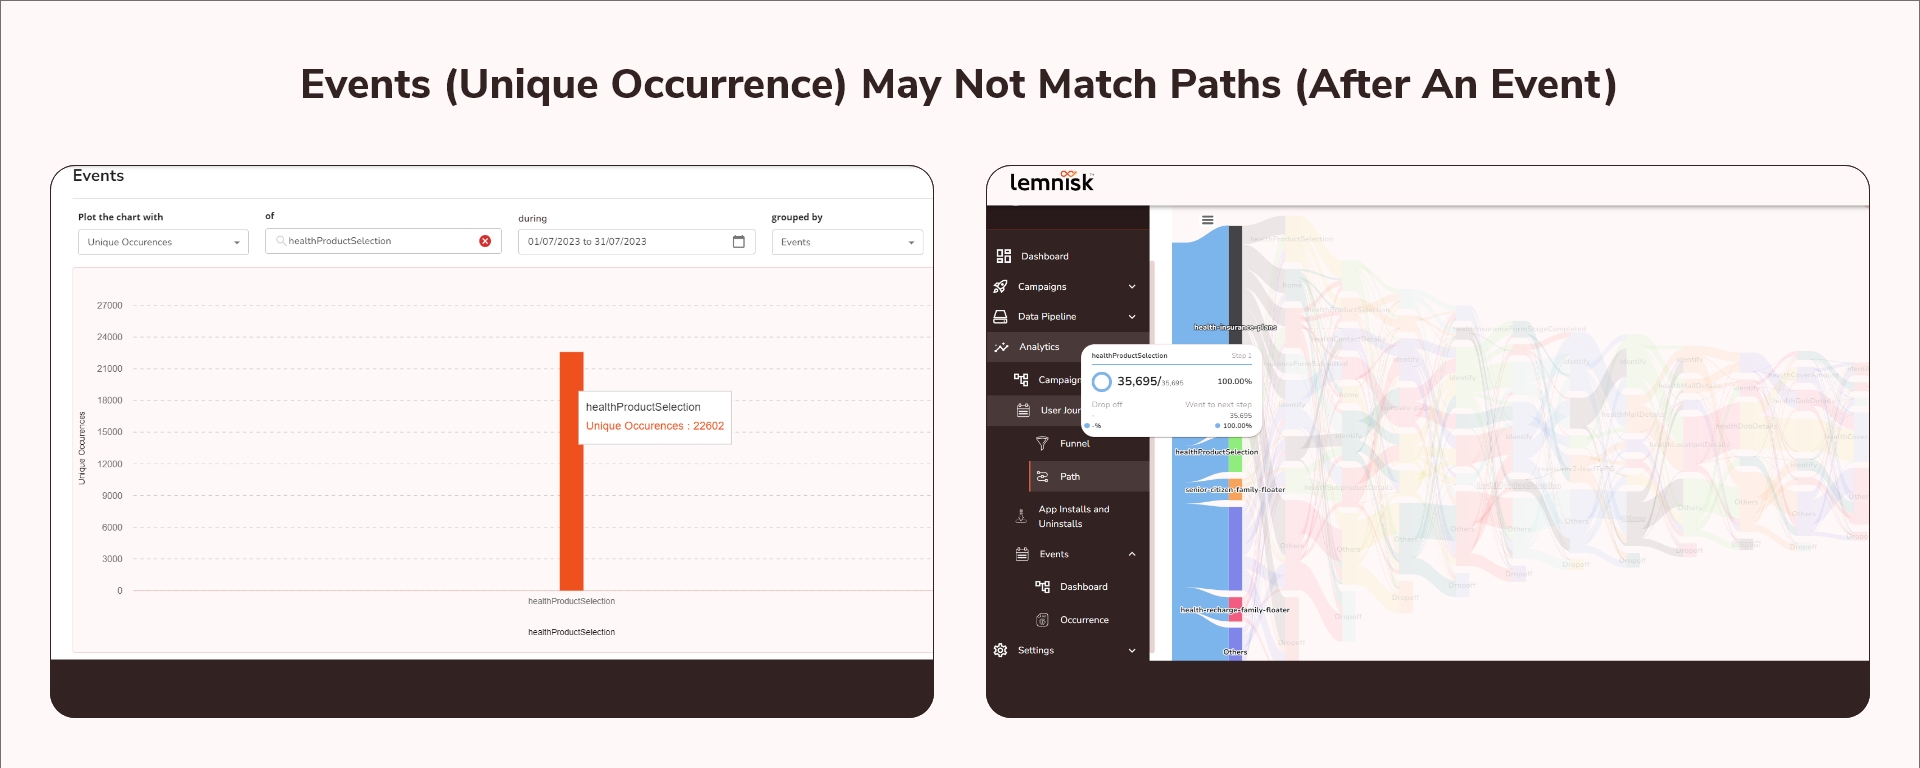
Case 7: The data in the Event (Unique Occurrence) may not match with the data in the paths (After An Event)
The data in the Event based on Unique Occurrence may not match the data in Paths (After An Event) because the data from the events shows the presence of Unique Users rather than Total Occurrences, whereas the path shows the data based on total events rather than Unique Users.
The user count in the Events based on the Unique occurrence is 22,602, and the user count from the Path (After An Event) healthProductSelection is 37,081. This difference is because the event based on unique occurrences shows the data of Unique Users, while the data in the Path (After An Event) is based on Total Occurrences.
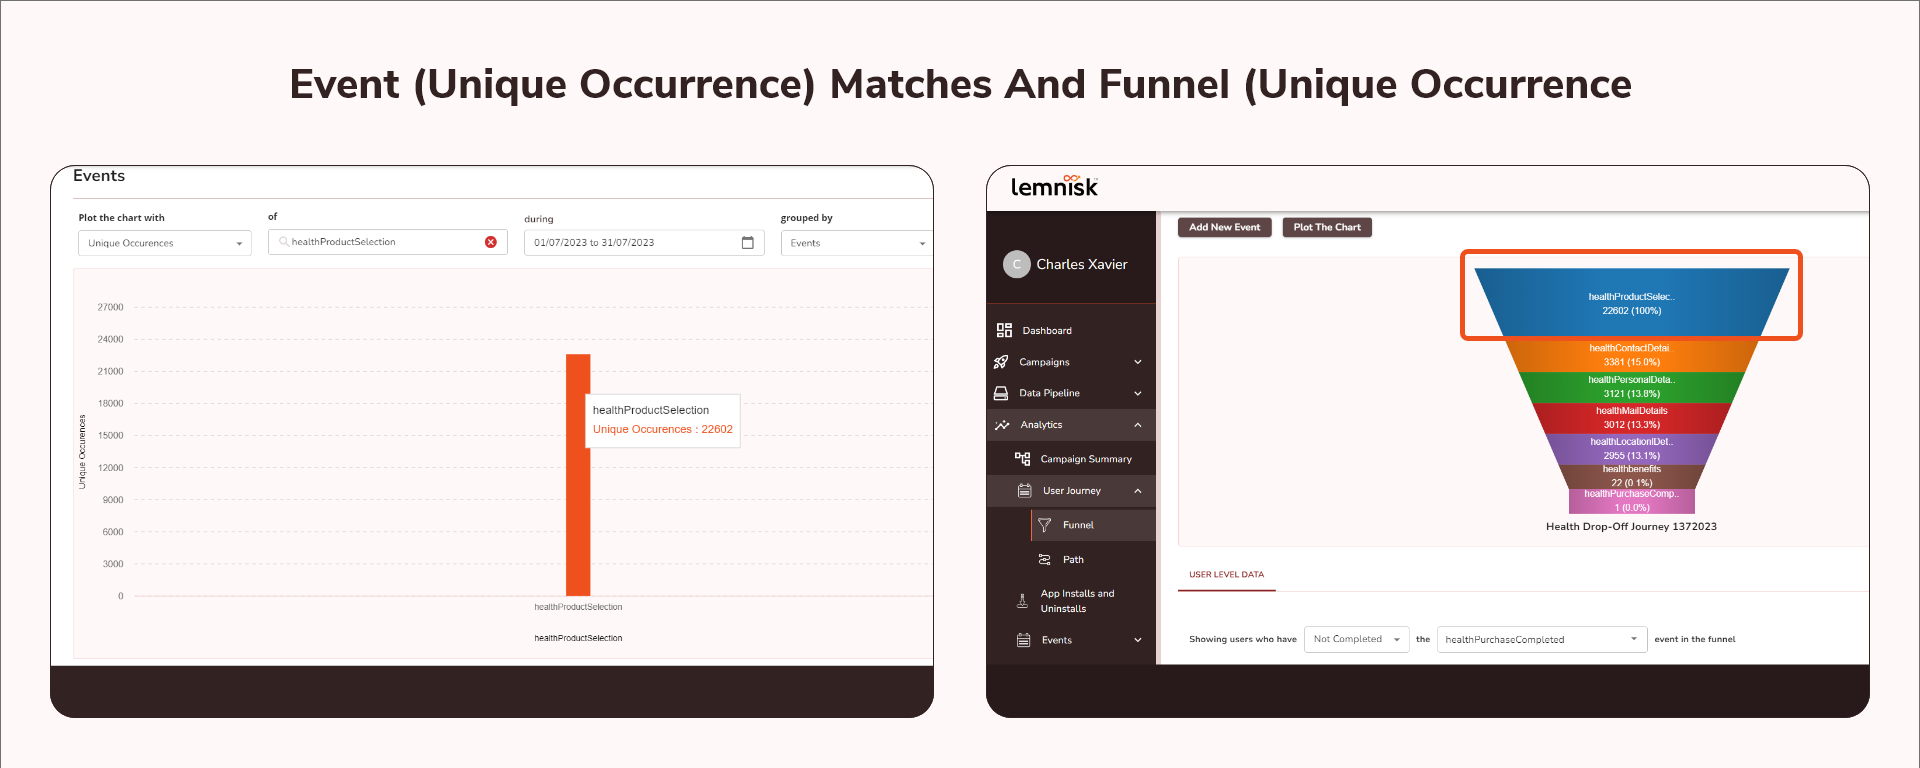
Case 8: The data in the Event based on Unique Users will match the data in the Funnels based on Unique Users.
The data from the Events based on Unique users and the Funnel based on Unique Users will match one another as both show the data of each Unique User in the overall events.
The above image comparison shows the data between Funnel (healthProductSelection) and Event (healthProductSelection) based on Unique Users, which have the same user count of 22,602.
Last updated