Funnels
Presenting the Funnel reporting use cases and methods to create the funnel
Funnel reporting is a powerful tool in marketing automation platforms that allows businesses to track the performance of their marketing campaigns and identify areas for improvement. Funnel reporting bridges the gap between marketing campaigns and customer engagement to prevent customers diverting from the defined conversion path while engaging with your Website/Mobile Application.
Use cases of Funnel reporting
Lead generation: Funnel reporting can be used to track the performance of lead generation campaigns and identify which tactics are most effective at driving leads through the funnel.
Sales conversion: Funnel reporting supports tracking the performance of sales conversion campaigns and identifying effective methods that convert leads into paying customers.
Retention and loyalty: Funnel reporting can be used to track the performance of retention and loyalty campaigns and identify effective methods to keep customers engaged with a brand.
ROI Tracking: Funnel reporting can be used to track the ROI of different campaigns which allows businesses to identify which campaigns are the most profitable and allocate their resources accordingly.
Use Case
Let's take a use case where you want to maximize the number of leads from the website. Your lead conversion process is broadly divided into three steps:
User visits a page
User clicks a product
User submits the lead form
All three steps are classified into Page visited, UserClicked and leadForm1 events respectively.
You want to understand where are most of my users dropping off in the process. You can do it by selecting the appropriate events in the Funnels and analyzing where the most drop-offs are happening.
Create a Funnel
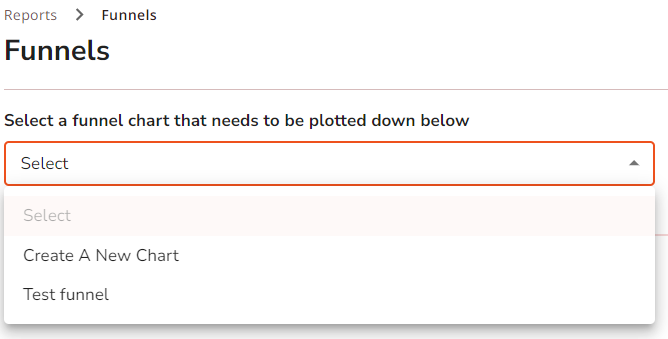
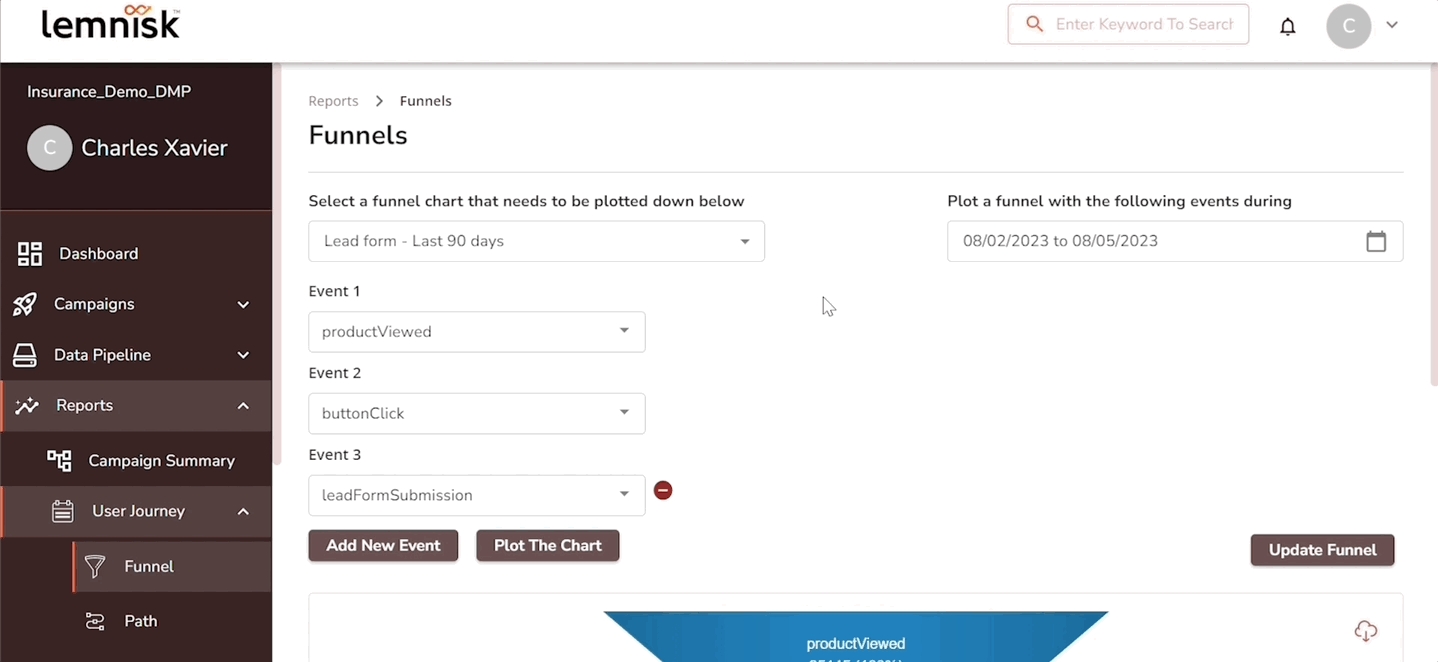
Step 1: Navigate to Analytics > User Journey > Funnel
Step 2: Select Create A New Chart
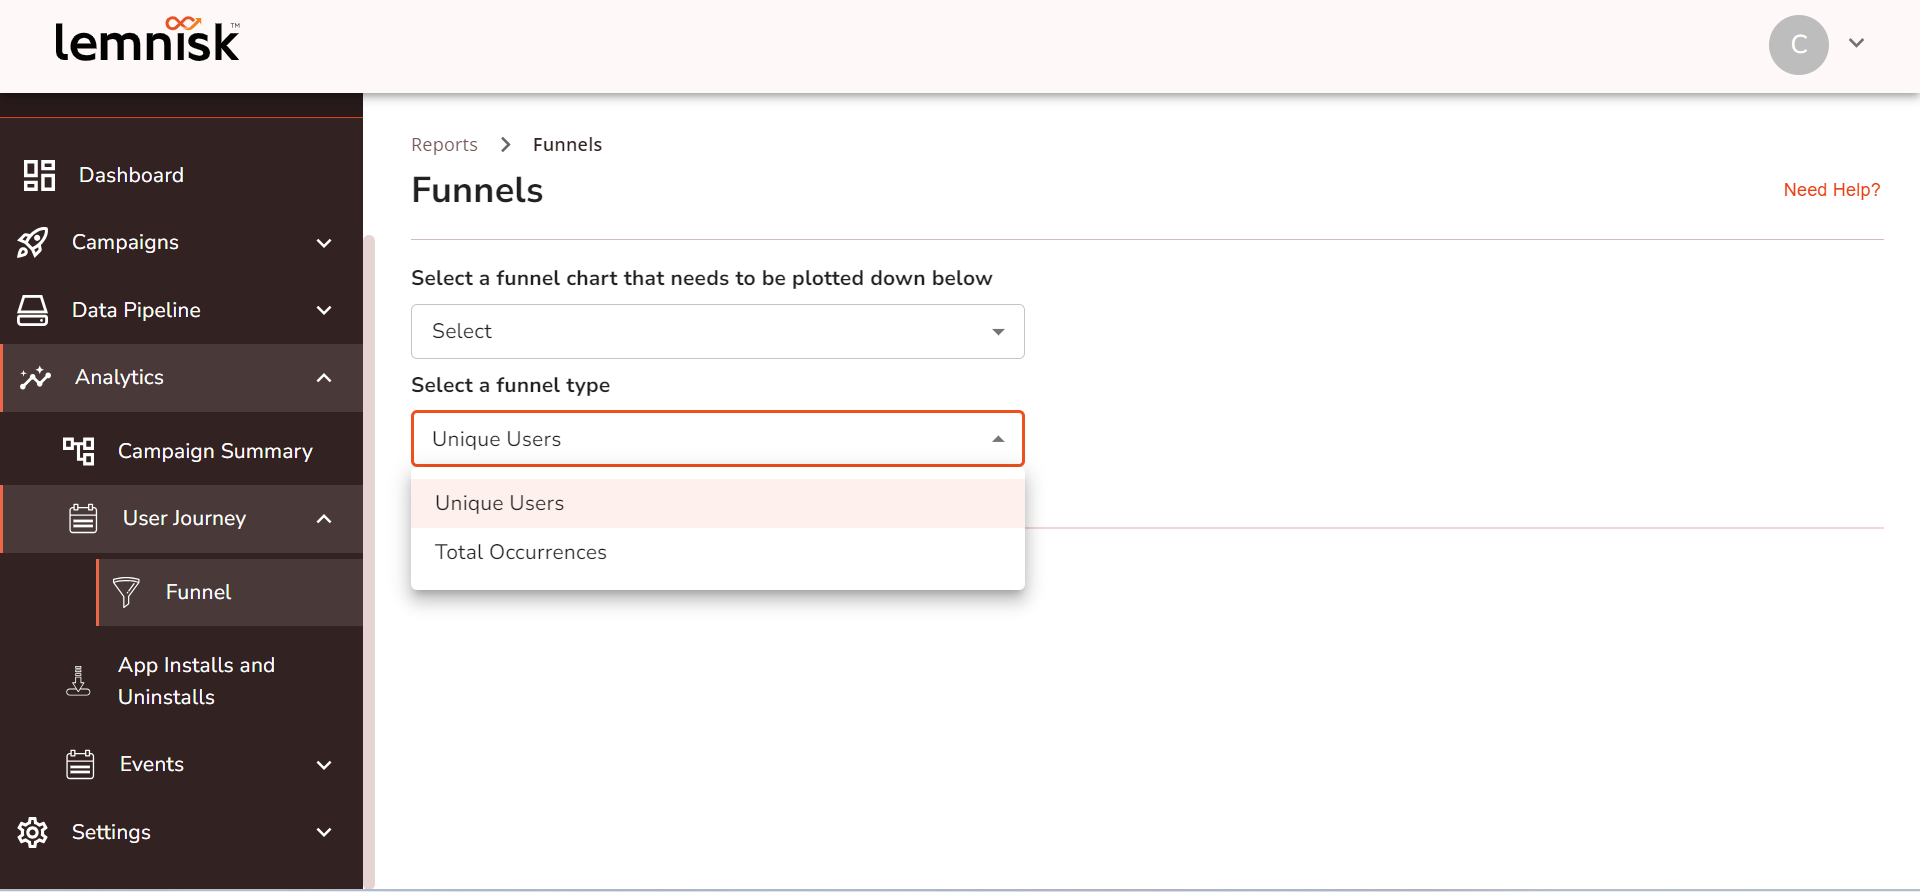
Step 3: Select Funnel Type
You can create funnels in two categories.
Unique Users Unique users help to know the funnel data of users who visited your website/application in any particular time frame at a unique user level. By selecting Unique Occurrence, the funnel will show the data based on the unique user counts rather than the frequency of events performed.
Total Occurrences Total occurrence helps to know the funnel data based on user events rather than unique users. By selecting total occurrence, the funnel will show the data based on the frequency of events performed by the users.
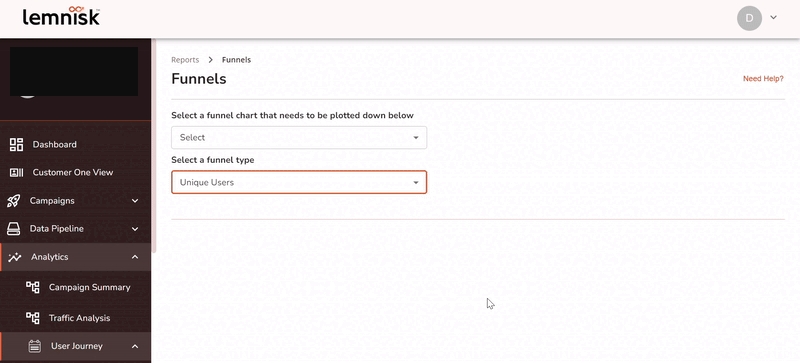
Step 4: Select the duration for the plot using the date range.
Step 5: Select the events which the user has to perform in the journey
Filters:
For events Open, Click and Impressions you can filter the funnel in Segment and Engagement level These events were tracked from Lemnisk's Engagement.
For events Track,Page visited, Page and Identify -type, you can filter the events based on URL
You can use filters while selecting the event to include and exclude URLs. This filter will help you fetch the required data from the events selected by including and excluding the page URLs as needed. This filter supports events such as page visits where the URL and page name can be different and there might occur a redundancy if the same URL occurs on different pages. With filters, now you can include and exclude the URLs as required while creating funnels to optimize user engagement.
It's mandatory to add URLs in the filters if you are selecting the event Page Visited. Also, note that the event Identifywill not provide the option to filter the URLs.
Use case 1- Plot funnel based on events
In this use case, we select the following event combination to filter the funnel based on events page visited , UserClicked and leadform1.
Page Visited from the drop-down for Event 1.
UserClicked for Event 2.
leadForm1 for Event 3.
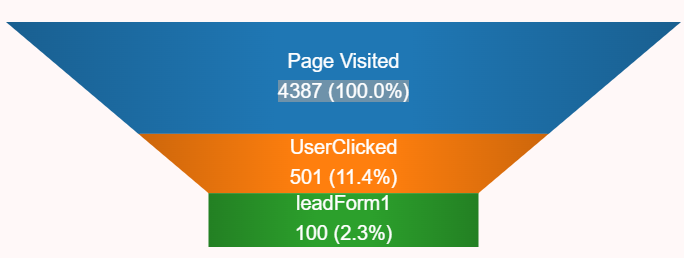
Based on the above event selection, here's how the funnel would look like
This funnel view interprets the traction of users in each event for better analysis of the level of engagement your website/application provides the users for performing the events determined by the marketeer.
The above funnel interprets the following events,
Event 1: Page Visited 4387 (100 %):
This section shows the number of users who visited the page.
Here, In Total, 4387(100%) users visited the page.
Event 2: UserClicked 501 (11.4%):
This section shows the number of users who clicked a button on the website.
Here, in total, 501 users clicked a button which is 11.4% of the total users who visited the page.
The maximum drop-off is between Event 1 (Page visited ) and Event 2 (UserClicked). This helps the marketeer get the insights that a lot of users who visit the page are not clicking the button for the lead form submission model. Now, the marketeer can take actions based on this data such as :
Making the product more appealing to the user
Showing the modal based on the scroll
Leveraging Lemnisk's Onsite Notification to insist the user fill the lead form
The funnel reporting provides detailed insights into each event to support the marketeer in gaining insights about the flaws that cause drops and taking necessary actions to make users achieve the determined goal without dropping.
Event 3: leadFormSubmission 100 (2.3%)
This section shows the number of users who submitted the lead form and the exact goal determined by the marketeer.
Here, In Total, only 100 users submitted the lead form which is 2.3% of the total users who clicked the product.
The majority of users who entered the campaign failed to achieve the final goal. This funnel reporting supports the marketeer to analyze the gap and take necessary actions.
Use Case 2: Filter Funnel based on Engagement_Impression
Engagement_ImpressionIn this use case, we select the following event combination and filter the funnels for event Engagement impressions in browser level.
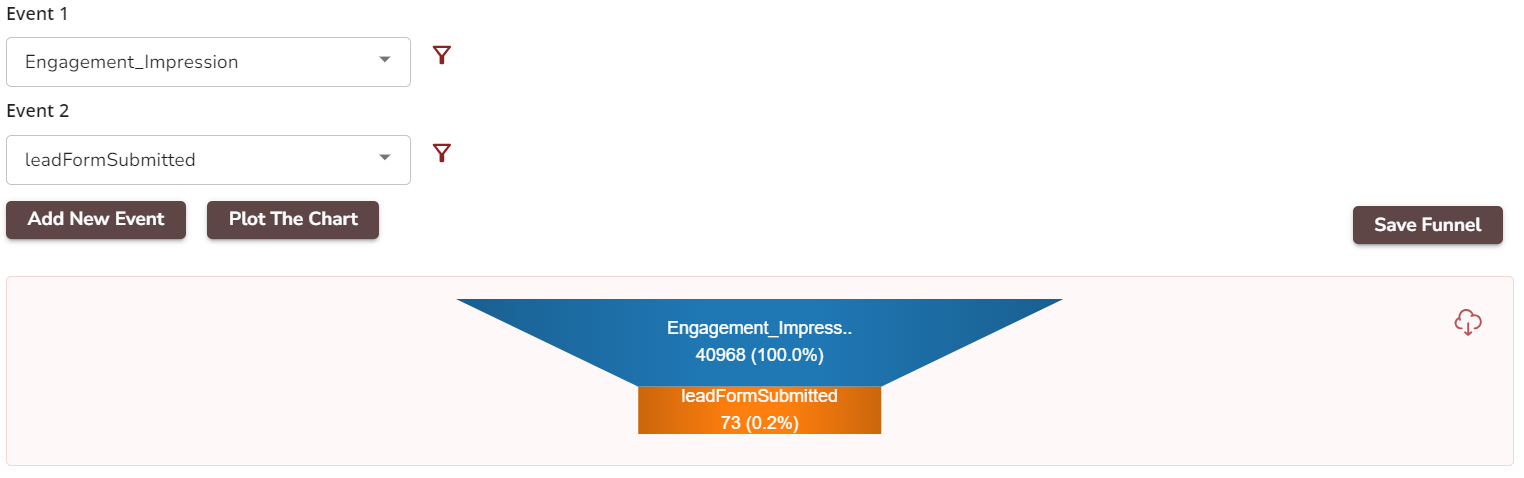
1)Engagement_Impressionfrom the drop-down in Event 1.
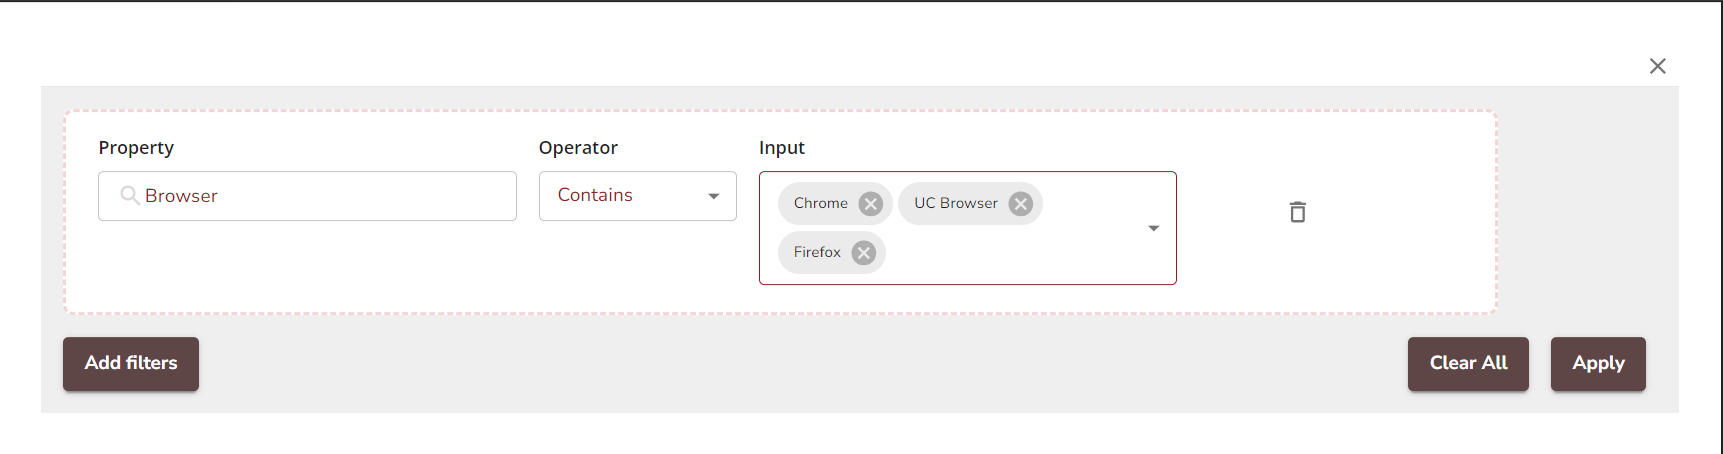
Click on the Filter Icon, select Add Filter and apply the filters as follows.
Property: Browser
Operator: Contains
Input: Chrome, UC Browser, Firefox
2) LeadFormSubmitted in Event 2.
The funnel will be plotted as shown below,
Update and Save a Funnel
Add an event
To add new events, click the Add New Event button displayed below the events.
Delete an event
To delete the events click (-) displayed next to each event.
Save Funnel
To save the funnel click the save icon on the edge of the window, Name your funnel, and click Save. The saved funnel chart can be fetched under the Select new funnel chart field.
Update Funnel
You can update the existing funnel by adding additional events as shown below.
You can plot the funnel with a maximum of 25 events. It may take some time to load the funnel if the number of events in the funnel is large.
Tabular Representation
Split Funnel Data
You can split the funnel data by Date, Week, and Month.
Date: Splits the data date-wise according to the number of users who performed each event with its percentage.
Week: Splits the data according to the number of users who performed each event and its percentage every week.
Month: Splits the data according to the number of users who performed each event and its percentage month-wise.
User Level Data
A marketer will always want to know about the details of the users who have not entered a specific funnel and left the platform without performing the determined goal. User-level data allows the marketer to fetch the details of those users who have failed to perform specific events in detail and export them to the segments to retarget the users.
Use Case
Let's say,
As a marketeer, you want to know the users who completed all the steps of the funnel except the last step. Let's assume the last step is identified as proceedToBuyevent.
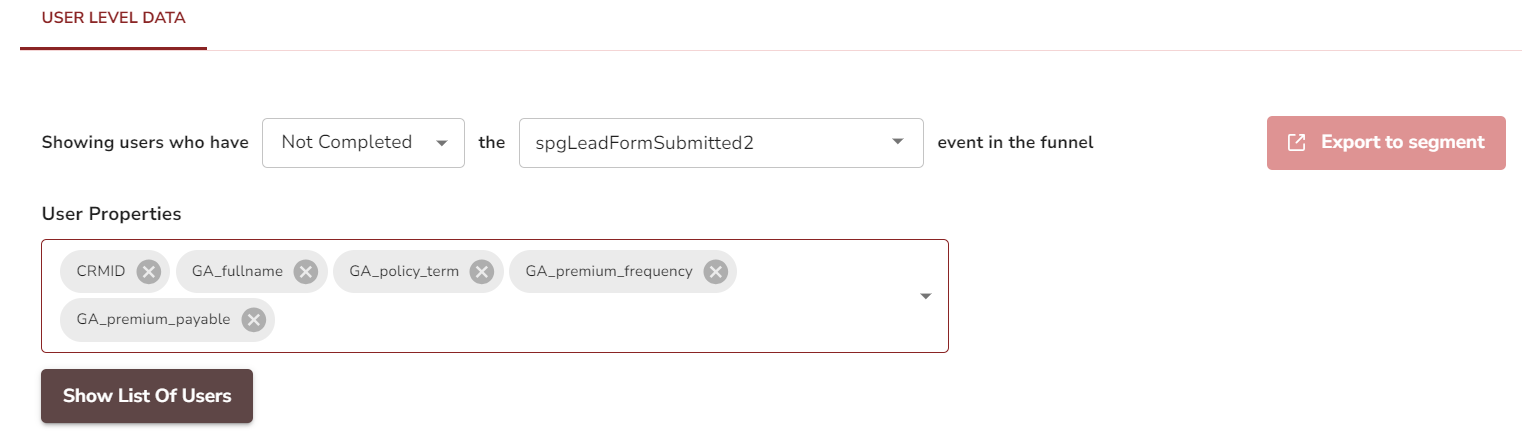
In this use case, to find the users who have not completed the event proceedToBuy we have selected Not Completed in the given field and selected the event proceedToBuy to fetch the data of the users who failed to achieve this event.
User Properties
User properties mentioned here are the macros that explain the details about the user which support the marketeer in getting more details about the users and taking streamlined action to target them.
Export to Segment
You can export the fetched data of those failed users to create segments and retarget the users via different channels.
To export the data, click the Export to Segment Button. This button will be enabled once you click the Show List of Users button.
In Total Occurrence, the user-level data shown below the funnel chart will be based on the unique occurrence only because the duplicate users will be filtered out from the list. As a result, your funnel count and user count may not match.
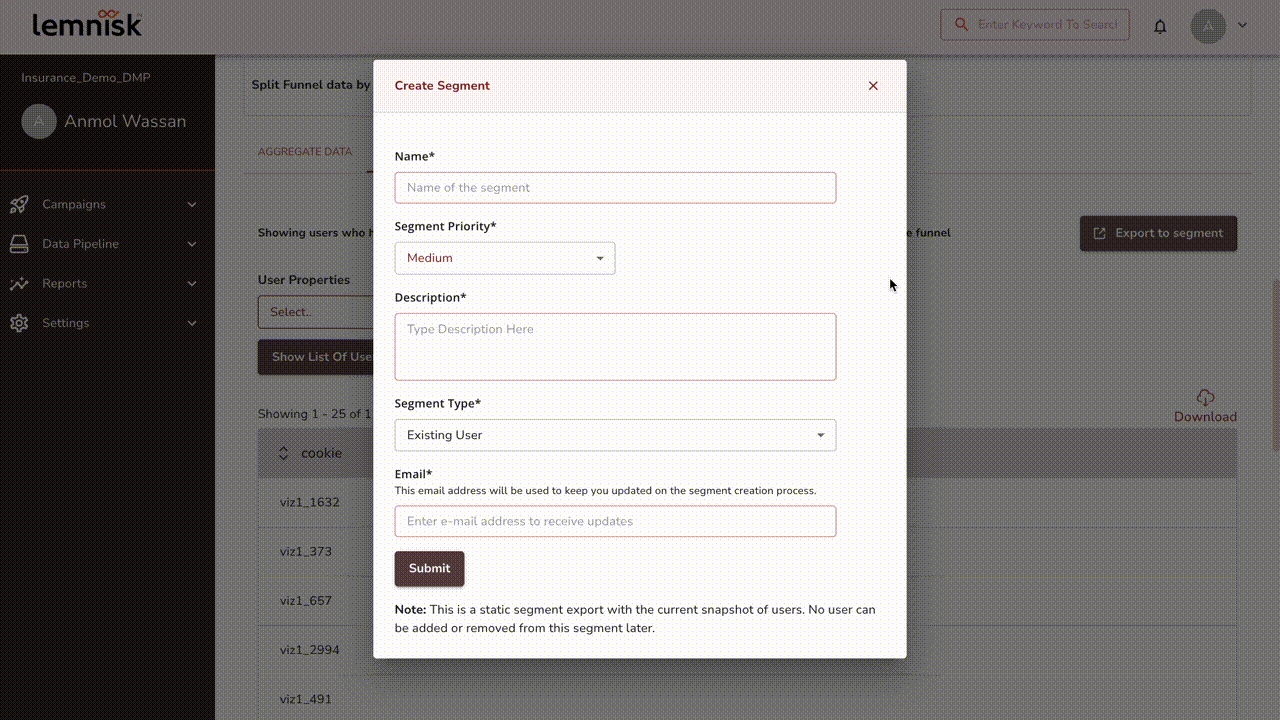
Create a segment with the following steps,
Step 1: Name your segment
Step 2: Set priority and enter the description
Step 3: Select the segment type
Step 4: Click Submit
A pop-up will display saying Request received successfully, We will send you further updates through (xxx@ymail.com)
Since the process is asynchronous, The segment cannot be created immediately while exporting from funnels. You will get notified through email once the segment is created.
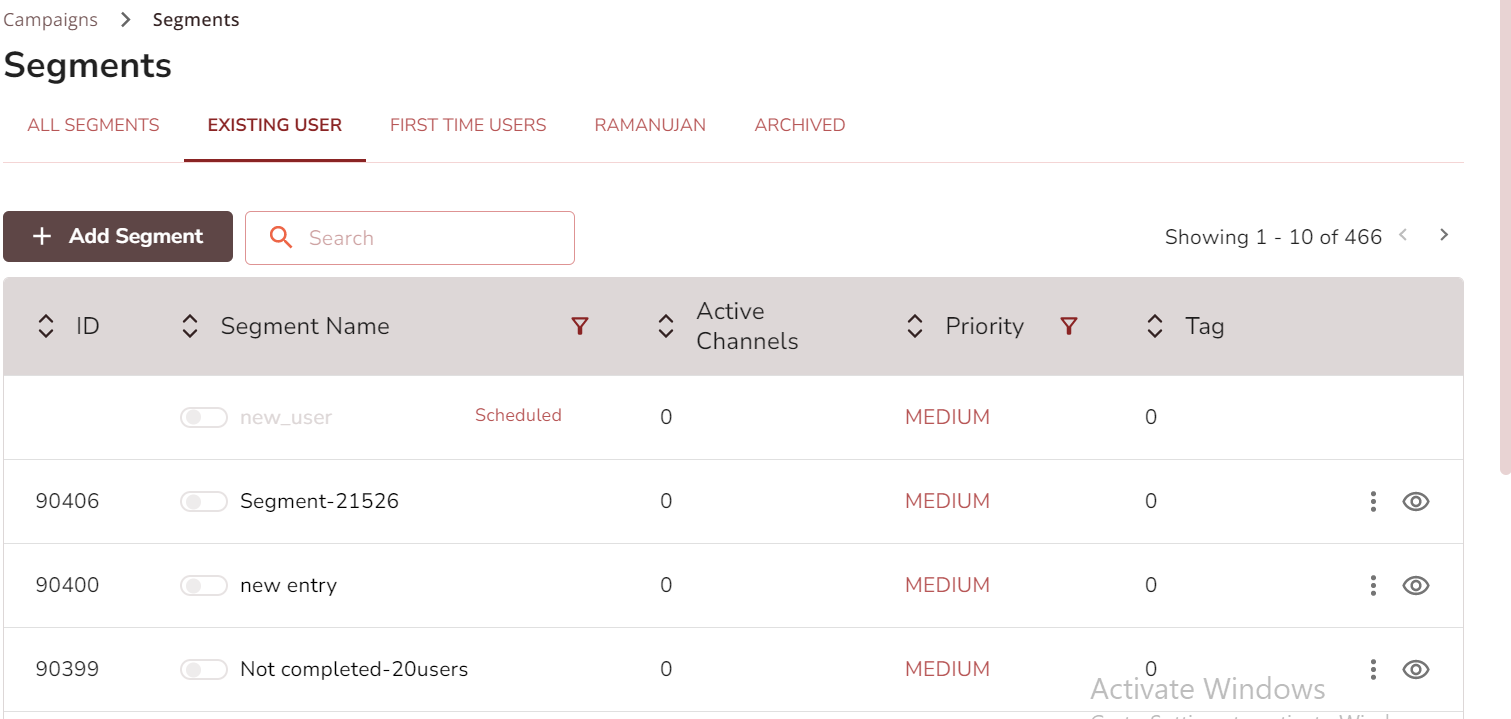
You can check the status of your segment through Campaigns > Segments
Once the segment export is completed, you can start creating engagements for that segment.
Note: The segment's actual user count may differ from the user count shown during export or email. During the segment creation process, users who are blacklisted and/or merged will be filtered and won't be included in the segment. Your segment user count will show you the actual users you could potentially target.
Last updated